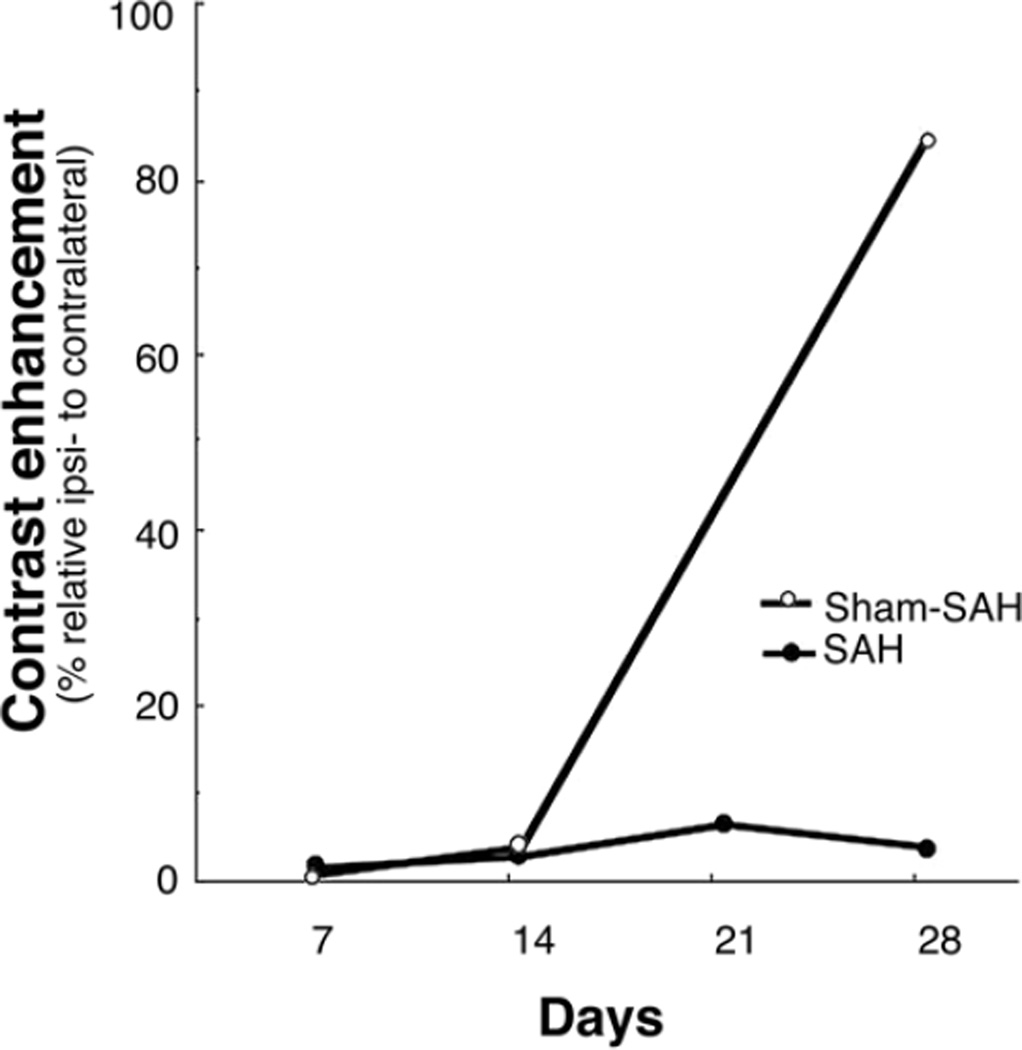
Fig. 3.
Line graph depicting the relative density (%) of the contrast in the sylvian fissure on the side ipsilateral to surgery compared with the maximum density on the side contralateral to surgery after injection of contrast into the cisterna magna on CT cisternography on Days 7, 14, 21, and 28 after SAH and on Days 7, 14, and 28 after sham SAH surgery. The graph demonstrates a persistent decrease of contrast penetration for 2 weeks after sham SAH surgery and for 4 weeks (the end of study) after SAH. Note the undisturbed distribution of contrast on the unoperated side and initial limitation, but recovery, of CSF distribution on the side of sham surgery (Sham-SAH) between 2 and 4 weeks after surgery.

