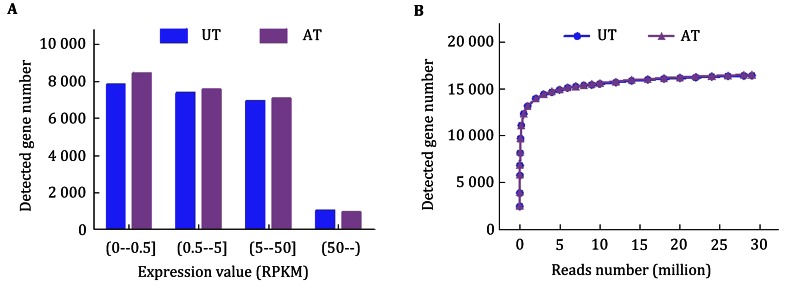
Fig. 2.
Summary of RPKM values of uniquely mapped genes and saturation analyses of the samples. A The RPKM value for each gene was calculated using uniquely mapped reads. B Each saturation curve was generated by randomly selecting a number of reads from each sample library and analyzing the number of genes detected. UT untreated MDA-MB-231 cells. AT MDA-MB-231 cells treated with 50 μmol/L AuNRs for 24 h

