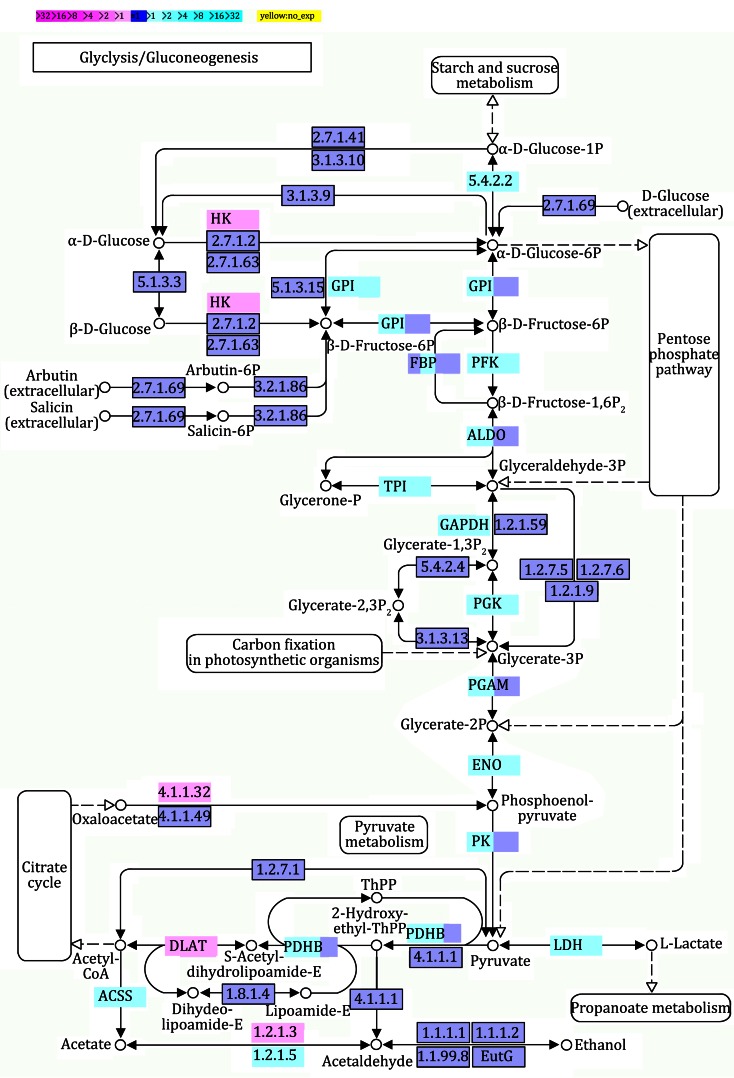
Fig. 4.
Differential gene expression in glycolysis/gluconeogenesis pathway in AuNR-treated MDA-MB-231 cells. Magenta and cyan colors represent up-regulated and down-regulated genes, respectively. The extent of regulation of the glycolysis/gluconeogenesis pathway provided by each gene is represented by color grade

