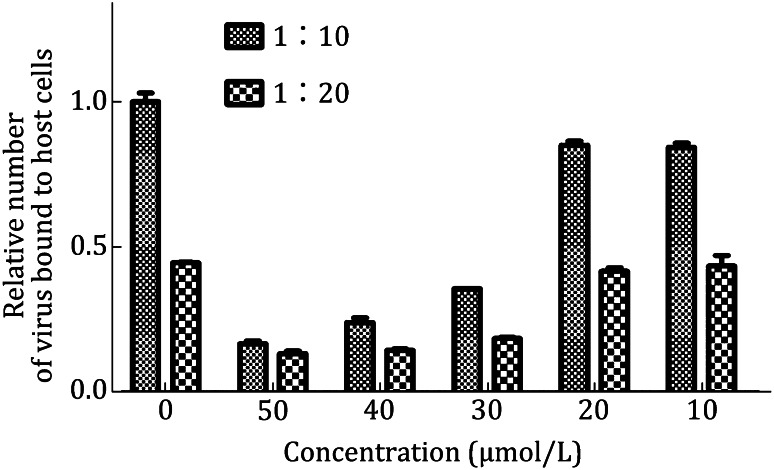
Fig. 6.
Cell binding assay. RD cells were used to compare the cell binding capacity of EV71 under the treatment with inhibitor at different concentration (50, 40, 30, 20, and 10 µmol/L, respectively). Two conditions were assessed: tenfold diluted (1:10) and 20-fold diluted (1:20) standardized viral stocks (108 TCID50/mL). The quantification of bound virus was measured by quantitative real-time RT-PCR assay and expressed as the virus binding by using 0.5% DMSO as control. Vertical bars indicate minimum/maximum values

