
Fig. 1.
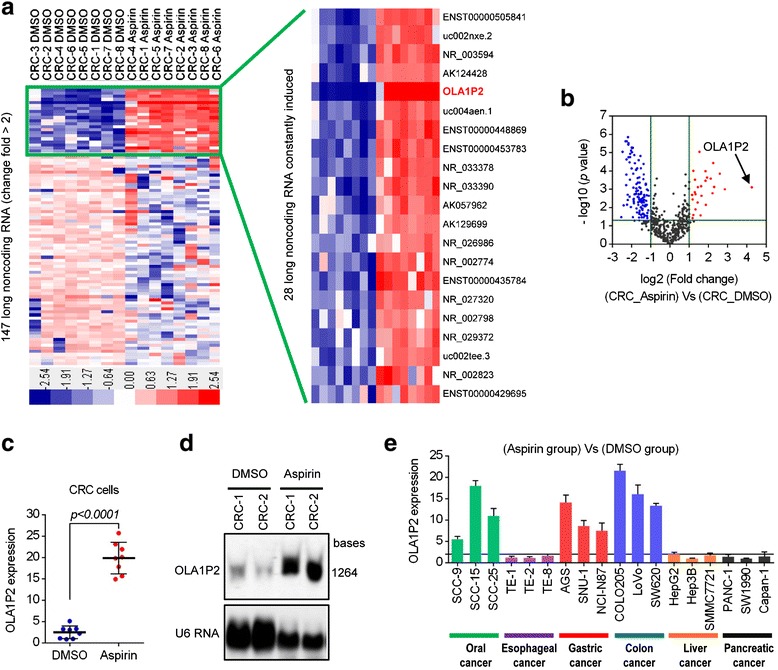
Aspirin-induced lncRNA OLA1P2 upregulation in cancer cells. a Primary cultured colon cancer cells were treated with aspirin (100 μM) for 48 h and then evaluated to determine their lncRNA profiles using an lncRNA expression microarray. Red indicates high expression; blue indicates low expression. b A volcano plot showing the relationship between the P values and the magnitude of the differences in the expression values of the samples in the different groups. c The expression level of OLA1P2 was validated by qRT-PCR analysis in all eight pairs of CRC cells with or without aspirin treatment. d Primary cultured colon cancer cells were treated with aspirin (100 μM) for 48 h and then evaluated for OLA1P2 expression using northern blotting analysis. e Cancer cell lines were treated with aspirin (100 μM) for 48 h and then evaluated for OLA1P2 expression using qRT-PCR analysis