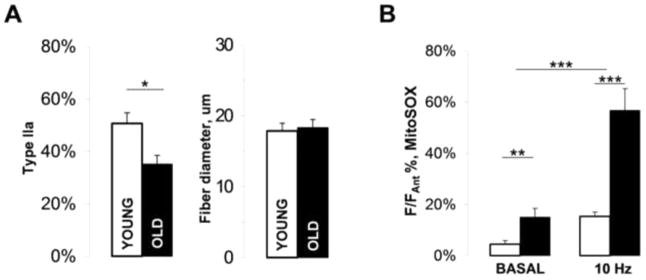
Figure 1. Age-related changes in muscle fiber composition and ROS production in the levator auris longus (LAL) muscle.
(A) Bar charts showing the abundance of type IIa muscle fibers (right) and the average Ferret’s diameter for all muscle fibers in old and young LAL (left). (B) Quantification of ROS production in young and old LAL NMJs during rest and nerve electrical stimulation. The values shown are MitoSOX fluorescence intensities normalized to the maximal MitoSOX responses obtained with antimycin A. Error bars are SEMs.

