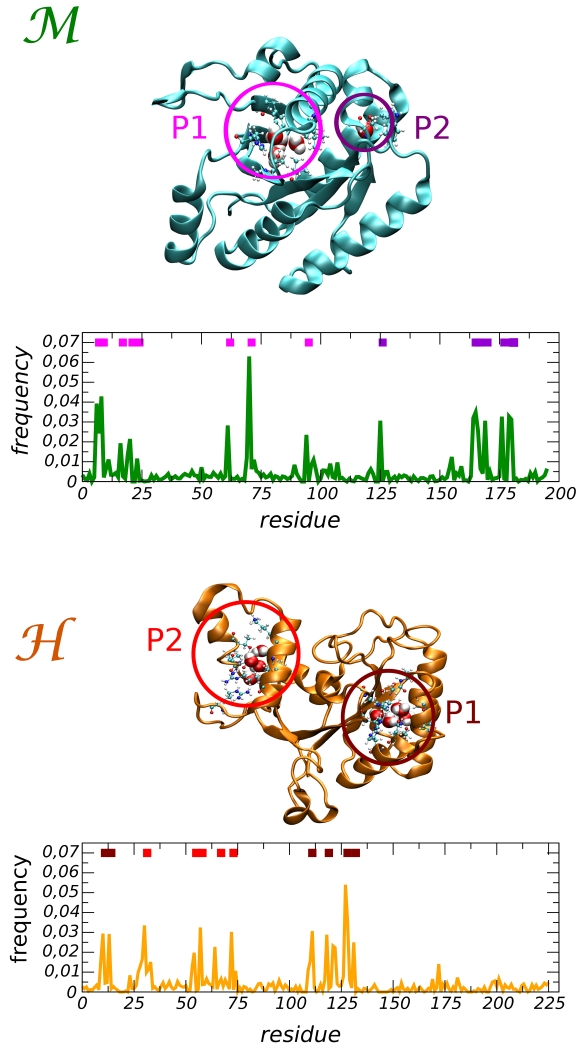
Figure 2.
Frequency distribution of long residence water molecules in the protein matrix for the (top) and the (bottom) domains. Two pockets are distinguished for each protein and indicated by the colored bars within the graphs. Their location in the 3D protein structure is shown at the top of each graph.

