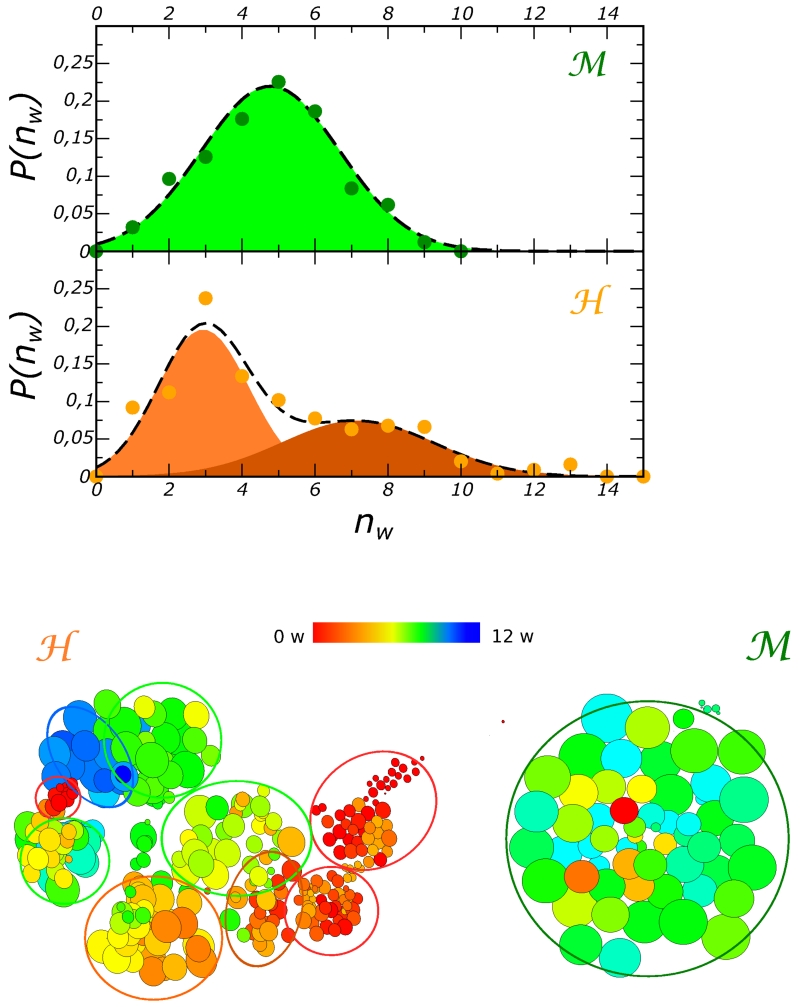
Figure 5.
Top panel. Frequency distribution of the number of long-residence water simultaneously located inside the protein matrix, nw. For this plot the residence time threshold is τc > 15 ns. The colored zones represent the area underneath the Gaussian functions fitting the distributions.
Bottom panel. Network representation of the conformational landscapes sampled by the two proteins. The network is obtained by clustering the MD trajectories and using the native contacts order parameter Q. The color map represents the hydration states of internal sites, red indicates fully dehydration, while blue indicates maximal internal hydration.

