Figure 1.
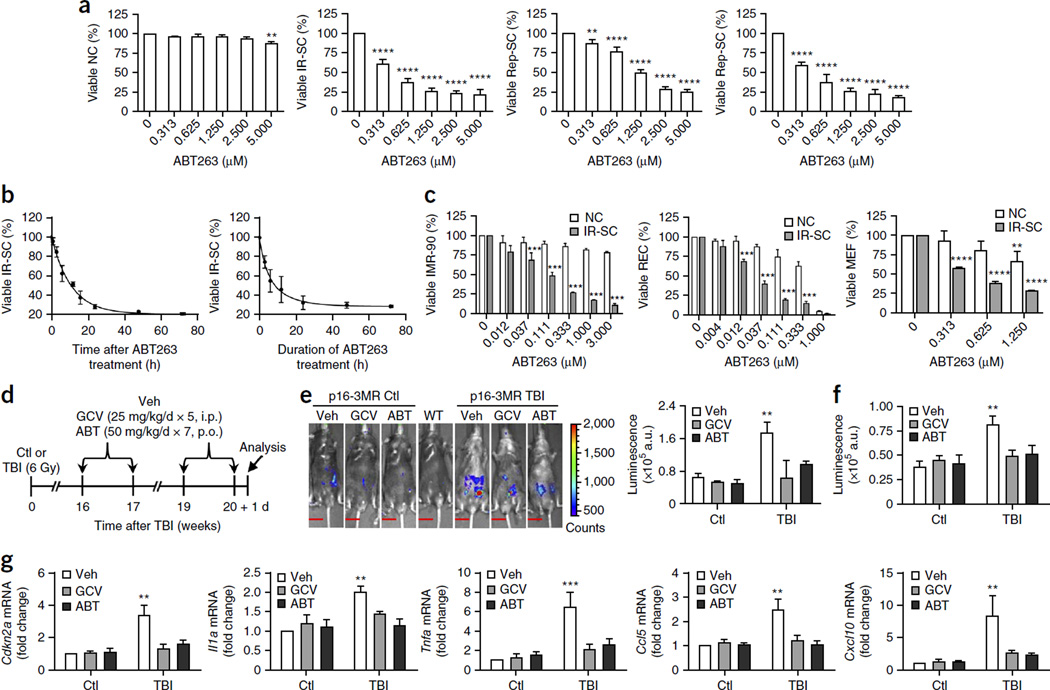
ABT263 has senolytic activity in cell culture and mice. (a) Quantification of viable WI-38 non-senescent cells (NC), IR-induced senescent cells (IR-SC), replication-exhausted senescent cells (Rep-SC) or Ras-induced senescent cells (Ras-SC; in which oncogenic Ras is ectopically expressed) 72 h after treatment with increasing concentrations of ABT263 (n = 3–6 for NC and IR-SC; n = 3 for Rep-SC; n = 4 for Ras-SC). (b) Quantification of viable IR-SCs at the indicated times after treatment of the IR-SCs with 1.25 µM ABT263 (left) or after the cells had been incubated with 1.25 µM ABT263 for the indicated amounts of time followed by removal of the drug and a further culture period of 72 h (right) (n = 3). (c) Quantification of viable non-senescent (NC) and IR-induced senescent (IR-SC) human IMR-90 fibroblasts (IMR-90), human renal epithelial cells (REC) and mouse embryonic fibroblasts (MEF) 72 h after treatment with increasing concentrations of ABT263 (n = 3 per group). (d) Experimental design for e–g. Sham-irradiated (Ctl) and TBI-treated young male p16-3MR mice were administered vehicle (Veh), ganciclovir (GCV) or ABT263 (ABT) and analyzed as indicated. I.p., intraperitoneal injection; p.o., oral administration. (e) Left, representative luminescence images of Ctl and TBI mice after treatment with vehicle, GCV or ABT263. Right, quantification (in arbitrary units, a.u.) of whole-body luminescence (Ctl mice: vehicle-treated, n = 6; GCV-treated, n = 4; ABT263-treated, n = 6; TBI mice: vehicle-treated, n = 8; GCV-treated, n = 4; ABT263-treated, n = 7). A wild-type C57BL/6 mouse (WT) was included as a negative control. The vertical color bar indicates luminescence-signal strength. Scale bars, 15 mm. (f) Quantification of luminescence in lungs of Ctl or TBI mice treated as indicated (n = 5 per group). (g) Quantification of mRNA expression for Cdkn2a, Il1a, Tnfa, Ccl5 and Cxcl10 in lungs from Ctl or TBI mice treated as indicated (n = 4 per group). Throughout, data are means ± s.e.m. **P < 0.01, ***P < 0.001 and ****P < 0.0001 versus without ABT263 for a (one-way analysis of variance (ANOVA)); versus NC treated with the same concentrations of ABT263 for c; versus Ctl for e–g; two-way ANOVA for c–g.

