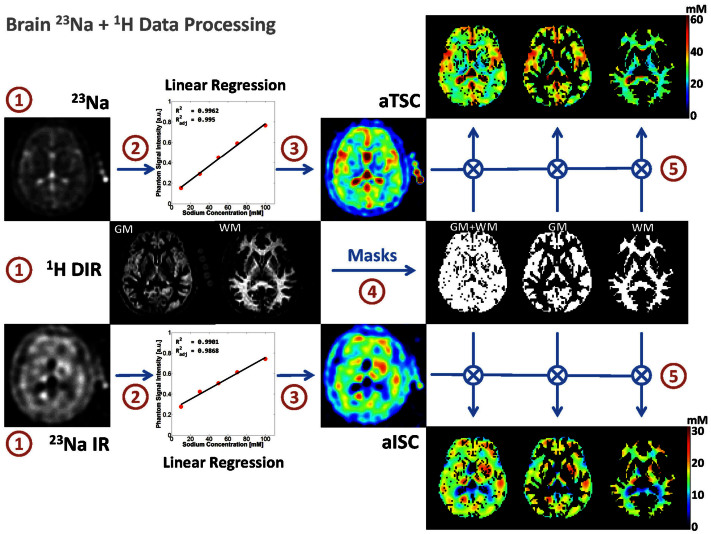
Figure 1. Diagram of the brain MRI data processing.
The process is divided in five steps: (1) 23Na data acquisition with and without fluid suppression by IR, and 1H data DIR acquisition; (2) Linear regression from the 23Na signal of the five calibration phantoms; (3) Calculation of the apparent total and intracellular sodium concentration maps (aTSC and aISC) from the linear regression; (4) Calculation of the GM, WM and full brain (GM + WM) masks from the DIR data using SPM8; (5) Multiplication of the sodium maps by the masks.

