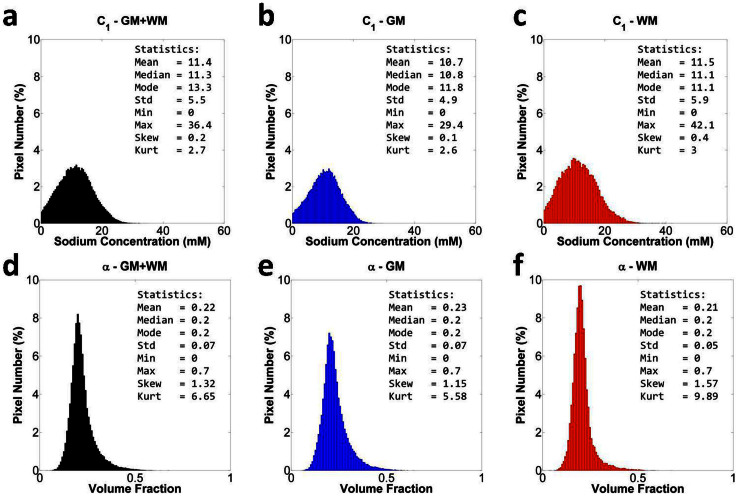
Figure 4. Distribution of all intracellular sodium concentration (C1) values and all extracellular volume fraction (α) values in full brain (GM + WM, black), GM (blue), WM (red) from a volunteer.
(a) C1 in full brain, (b) C1 in GM, (c) C1 in WM, (d) α in full brain, (e) α in GM, (f) α in WM. Statistical parameters of the distributions are included in the top right corner of each histogram. Pixel number is given in % of the total number of pixels in full brain, in GM and in WM, respectively. Abbreviations: Std = standard deviation, Min = minimum, Max = maximum, Skew = skewness, Kurt = kurtosis.

