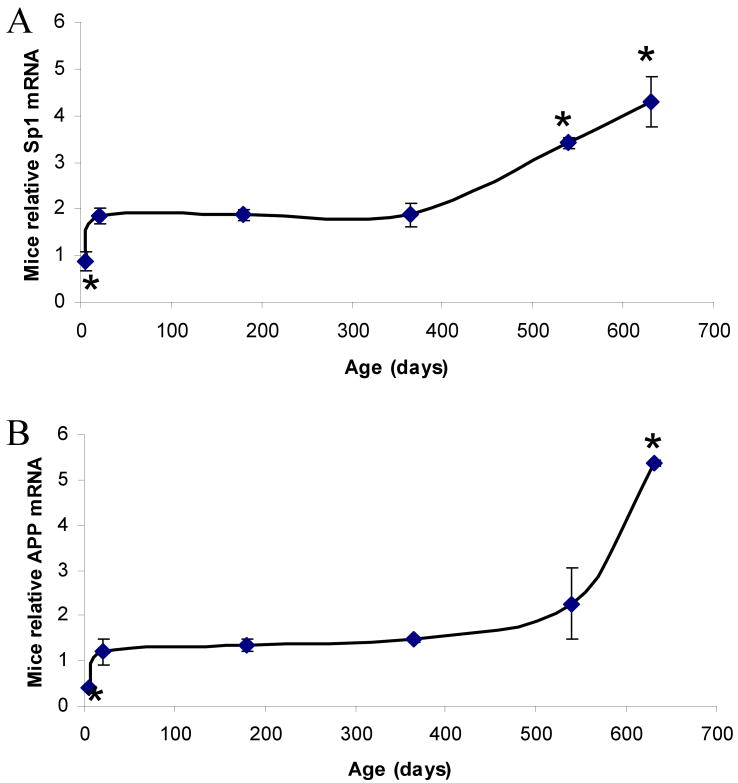
Fig. 1. Lifetime mRNA expression changes in AD related genes (Sp1, AβPP) in the mouse brain cortex.
Relative quantification was measured by using 7500 Real–Time PCR System (Applied Biosystems, CA) with β–actin serving as the endogenous control. A) Relative Sp1 mRNA signal. B) Relative AβPP mRNA signal. Each data point in the curve is the mean + SEM (n=3-4 animals). “*” denotes significant difference for SP1 or AβPP mRNA time point when compared to that of PND 365.

