
Fig. 2. Lifetime profile of AD related proteins (AβPP, SP1 Aβ) in the mouse brain.
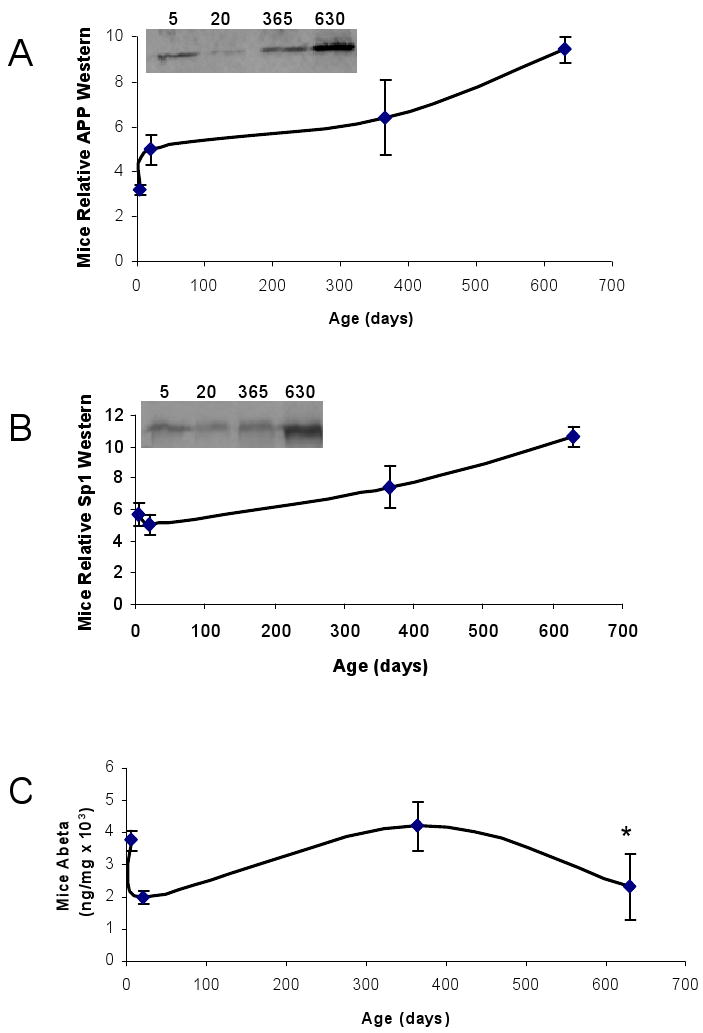
Protein from cortical tissue of wild–type mice was isolated, equal protein amounts were loaded and probed with 22C11 AβPP N–terminus antibody with SDS–PAGE western blot analysis as described in the methods section. The SP1 antibody used is mentioned in the methods section. Protein was also used to measure Aβ 1–40 by a sandwich ELISA assay (IBL, Japan). Six time points are shown. Representative blots are shown in insets for western analysis. A) Relative AβPP levels; B) Relative SP1 levels; C) Aβ40 levels. Each data point in the curve is the mean + SEM (n=3 animals). “*” denotes significant difference between Aβ levels at PND 630 as compared to PND 365. Western blot results were normalized to β–actin signal.