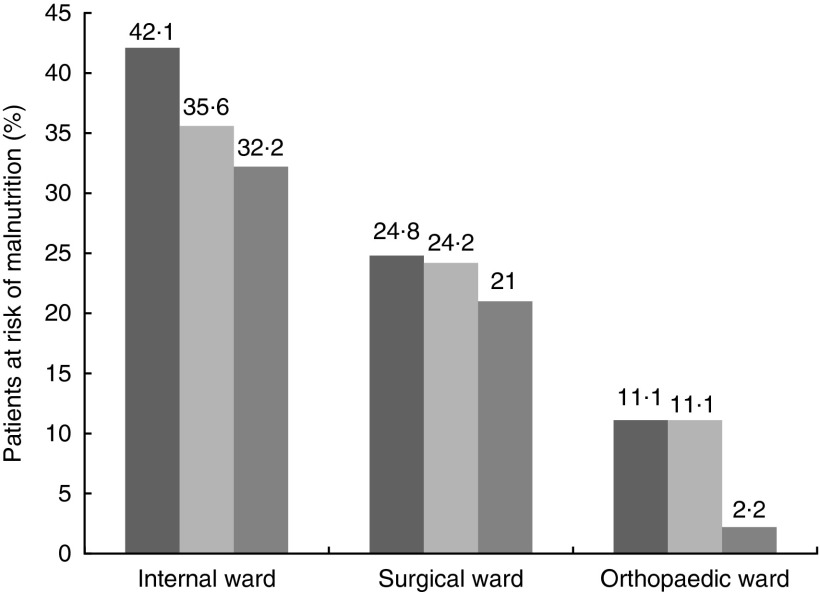
Fig. 4.
Percentage of patients identified to be at risk for malnutrition using the Graz Malnutrition Screening (GMS) and the Nutritional Risk Screening (NRS,  ). GMS 1 (
 ), Graz Malnutrition Screening Rater 1; GMS 2 (
 ), Graz Malnutrition Screening Rater 2; NRS, Nutritional Risk Screening Rater 3. All data are grouped for wards of assignment.

