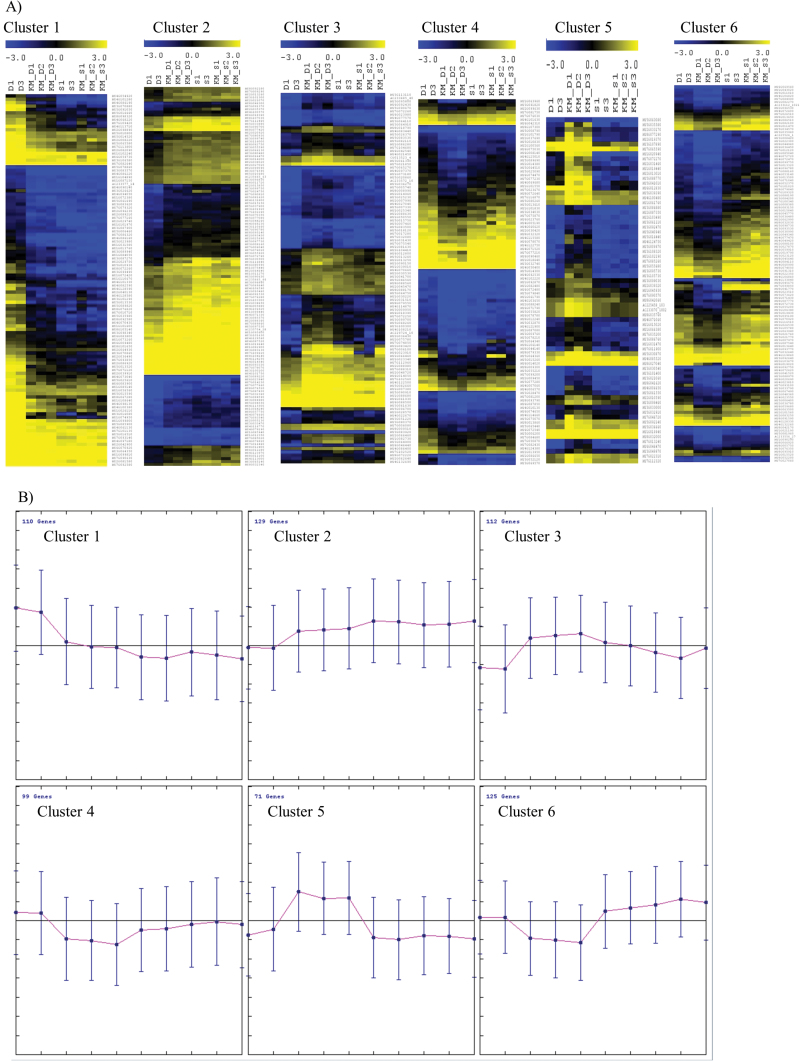
Fig. 5.
K‐means clustering (number of clusters: 6) of significantly expressed genes between drought‐stressed samples vs. drought‐stressed samples pre‐treated with 10‐8 M KM (FDR; P<0.05). (A) Heat map of median-centred values. (B) Average expression trends of the genes belonging to each cluster. The respective median-centred values of salt‐stressed samples with and without pre‐treatment with 10‐8 M KM are included in the clusters and depicted in the graphs. (This figure is available in colour at JXB online.)

