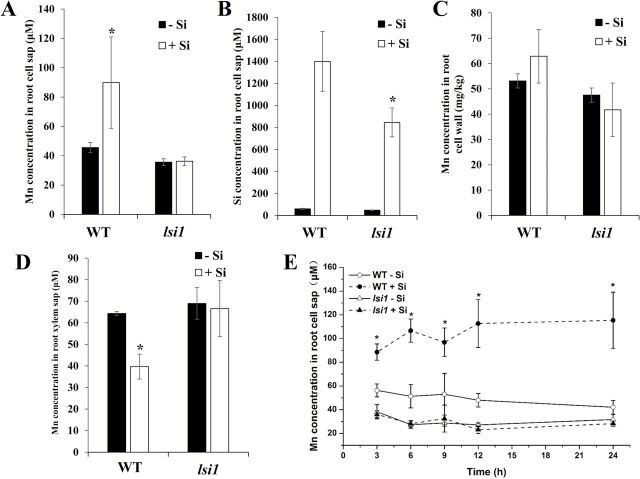
Fig. 7.
Effect of Si on Mn concentration in root cell sap and xylem sap. (A) Mn concentration in root cell sap; (B) Si concentration in root cell sap; (C) Mn concentration in the root cell wall; (D) Mn concentration in xylem sap. WT and lsi1 seedlings (28-d-old) were exposed to a nutrient solution containing 5 μM Mn without or with 1mM Si for 24h. (E) Time-dependent change of Mn in the root cell sap. WT and lsi1 seedlings (28-d-old) were exposed to a nutrient solution containing 5 μM Mn without or with or 1mM Si for up to 24h. Data represent the mean ±SD (n=3). Asterisks indicate significant difference (P<0.05) between -Si and +Si by Student’s t-test.

