Figure 1.
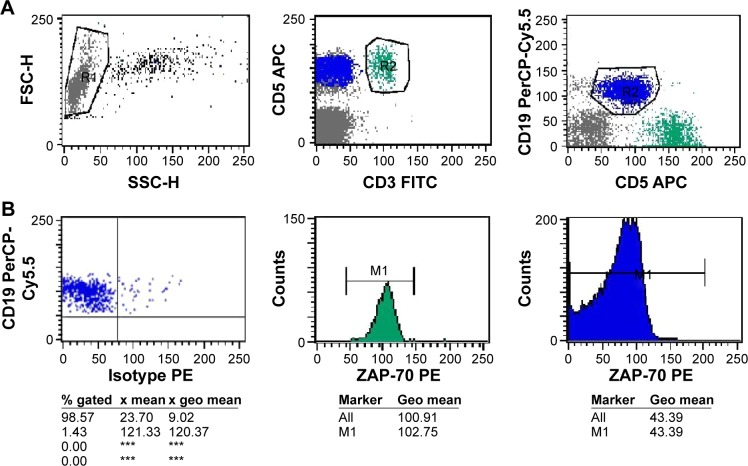
Flow cytometric analysis of a ZAP-70 positive sample (geo MFI index = 2.371). PB cells of CLL samples were analyzed after staining with anti-CD19-PepCP, anti-CD3-FITC, anti-CD5-APC and PE-conjugated isotype control or anti-ZAP-70 antibodies.
Notes: (A) shows the gating strategies used to select lymphocytes in the left plot, T cells (CD3+/CD5+) or CLL cells (CD19+/CD5+) in middle (green) and right plots (blue), upon gating on lymphocytes. (B) Shows the geo MFI index method was calculated from geo mean values as separately read from T cell and CLL cell gates (based on 256 channel resolution). In the left plot, a marker was set on the left edge of CLL cells clustered in an isotype control tube, in order to set the PE-geo MFI of CLL cells as 10±1; in the test tube, the geo mean of T cells and CLL cells was 102.75 and 43.39, respectively, as shown in the middle and right histogram. ***Not detected.
Abbreviations: ZAP-70, ζ-chain-associated protein kinase 70 kDa; PE, phycoerythrin; FITC, fluorescein isothiocyanate; geo MFI, geometric mean fluorescence intensity; CLL, chronic lym phocytic leukemia; APC, Allophycocyanin.

