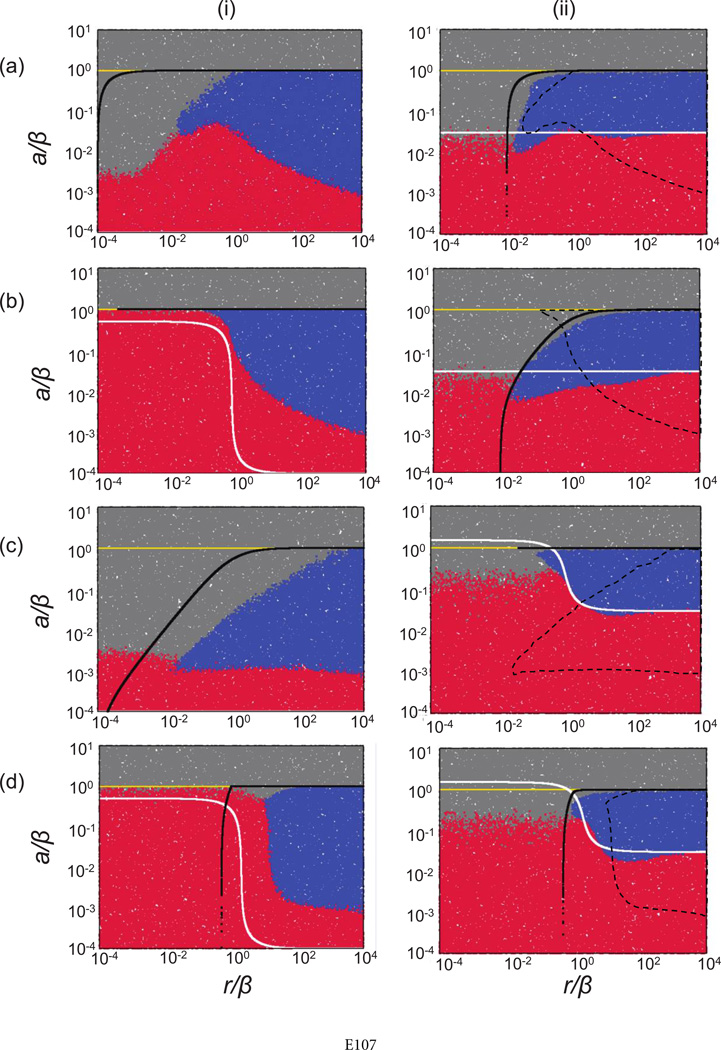
Figure 7.
Parameter dependence of the outcomes in the nearest-neighbor metapopulation (ii) and the corresponding nonspatial models (i) in the context of four specific models describing enemy-victim dynamics. Model a corresponds to the assumptions made in the agent-based model of host-pathogen dynamics explored in figure 2. Each point represents the outcome of a single run, indicated by the color code. Red indicates extinction of victim and enemy, blue indicates coexistence, and gray indicates persistence of the victim in the absence of the enemy. Above the white and below the black lines, the equilibrium number of victims and enemies, respectively, is greater than approximately 1 (see Supplementary Information [SI], sec. 4, available online), derived from corresponding ordinary differential equation (ODE) models. In the metapopulation model, this is the local equilibrium in a patch. Above the yellow line, the enemy fails to invade and the coexistence equilibrium is unstable in the ODEs, determined analytically. For ease of comparison, the dashed lines in the plots of the metapopulation system (ii) indicate the coexistence region for the corresponding nonspatial system. The models are as follows: a, dx/dt = rx[1 − (x + y)/K] − dx − (βxy/K), dy/dt = (βxy/K) − ay; b, dx/dt = rx[1 − (x + y)/K] − dx − [β xy/(x + y + ε)], dy/dt = [βxy/(x + y + ε)] − ay; c, dx/dt = ({rx[1 − (x + y)/K]}/(x + η)) − dx − (βxy/K), dy/dt = (βxy/K) − ay; d, dx/dt = ({rx[1 − (x + y)/K]}/(x + η)) − dx − [βxy/(x + y + ε)], dy/dt = [βxy/(x + y + ε)] − ay. The parameters r, β, and a were varied. The other parameters were assigned the following constant values: d = 0; ε = 1; η = 1; μx = 0.1; and μy = 0.1. KIoc= 100 for the local patch in the metapoploculation, and K = 10,000 for the mass-action system. The number of patches in the metapopulation was n = 100. Equal migration rates for x and y were assumed, to facilitate comparison to the agent-based model, but results hold for unequal migration rates. For the spatial models, the simulations were started with the central patch containing Kloc individuals, including 30 infected hosts. In addition, the five adjacent patches on each side contained susceptible hosts at carrying capacity. The remaining patches were empty. The cutoff time for the simulation when determining extinction versus persistence was determined as follows: the simulation was run until populations hit the boundary of the system and was subsequently run 1,000 times longer. For details of simulations, see text and SI, section 3.1.

