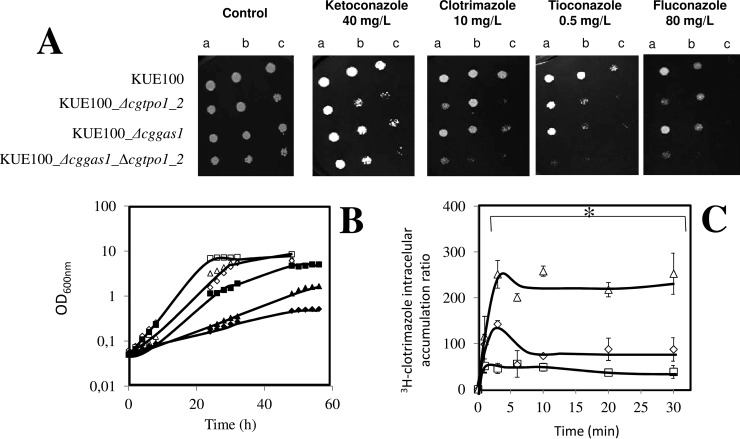
Fig. 9.
The combined action of CgTpo1_2 and CgGas1 confers resistance to azole antifungal drugs in C. glabrata cells. (A) Comparison of the susceptibility to azole antifungal drugs, at the indicated concentrations, of the C. glabrata KUE100 wild-type and KUE100_Δcggas1 strains, in BM agar plates by spot assays. The inocula were prepared as described under “Experimental Procedures.” Cell suspensions used to prepare the spots were 1:5 (B) and 1:25 (C) dilutions of the cell suspension used in (A). The displayed images are representative of at least three independent experiments. (B) Comparison of growth curves of C. glabrata KUE100 (■,□), KUE100_Δcggas1 (▴,Δ) and KUE100_Δcggas1_Δcgtpo1_2 (♦, ♢), in liquid BM, in the absence (open symbols) or presence of 90 mg/l clotrimazole (filled symbols), measured in terms of variation in OD600. The displayed growth curves are representative of at least three independent experiments. (C) Time-course accumulation of clotrimazole in KUE100 (), KUE100_Δcggas1 (224) and KUE100_Δcggas1_Δcgtpo1_2 (Δ) strains, during cultivation in BM liquid medium in the presence of radiolabeled 3H-clotrimazole. Accumulation values are the average of at least three independent experiments. Error bars represent the corresponding standard deviations. *p < .05.

