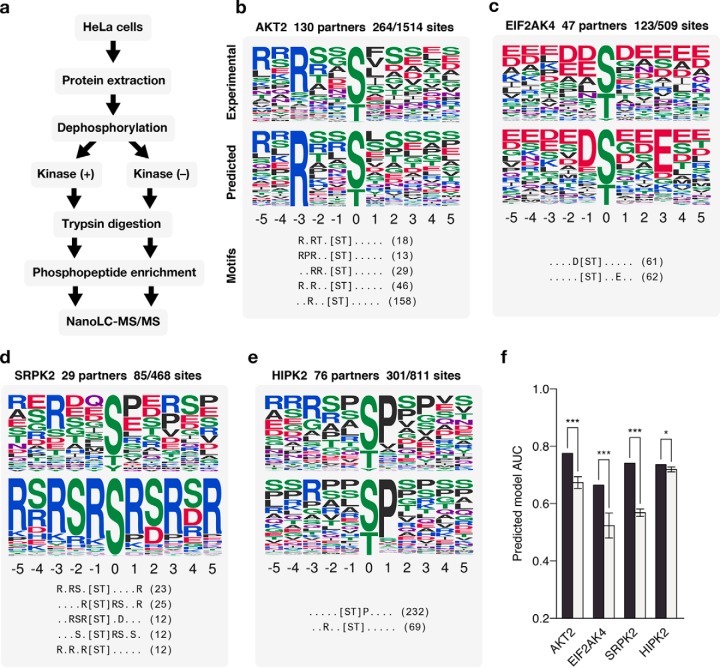
Fig. 3.
Experimental validation. (A) Workflow for identifying phosphorylation sites. (B–E) Predicted specificity models of four experimentally validated kinases. The top and middle panel of each example shows the specificity of the kinase as constructed from the target sites of these kinases identified via MS and as predicted by our method, respectively. The bottom panel shows the top five extracted motifs and the number of phosphosites matching them. (F) The performance of each predicted model compared with models predicted using random phosphosites.

