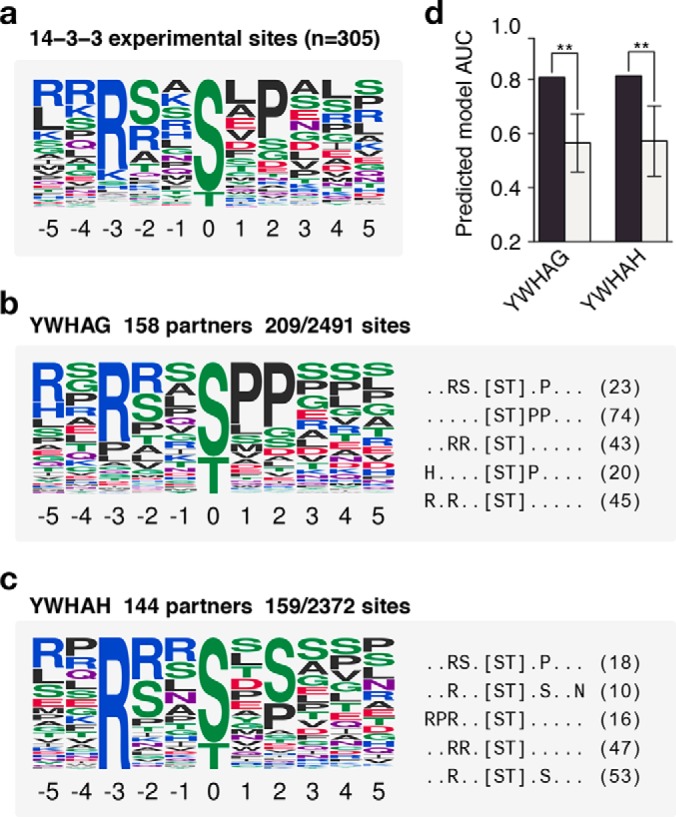
Fig. 4.

Prediction of 14-3-3 domain specificities. (A) The specificity of 14-3-3 domains as constructed by experimentally verified substrates. (B and C) Prediction of specificities for two 14-3-3 proteins. Each example shows a logo representing the predicted specificity (left) and the top five extracted motifs and the number of phosphosites matching them (right). (C) The performance of each predicted model compared with models predicted using random phosphosites. All cases perform better than random sampling of phosphosites (.p < .01, *p < .05, **p < .01, *** p < .001, one-sided z-test). Error bars represent the median absolute deviation of 1,000 random models.
