Fig. 1.
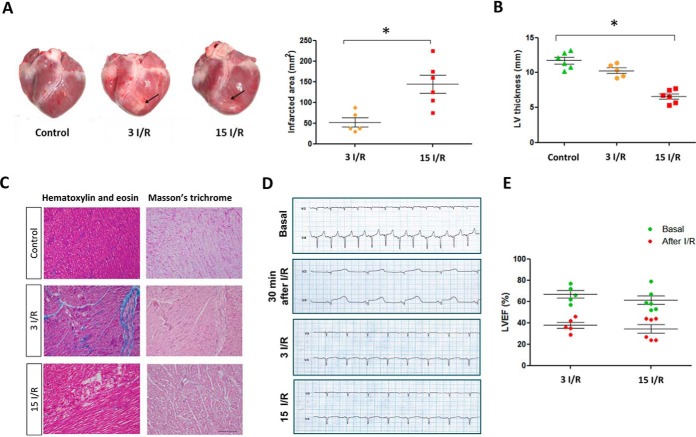
Characterization of I/R in the porcine model. A, representative pig hearts 3 days (3 I/R) and 15 days (15 I/R) after IR injury. Rows indicate the infarcted zone. Infarcted area (mm2) 3 days (3 I/R) and 15 days (15 I/R) after I/R. B, left ventricle thickness (in mm). C, Masson's trichrome and hematoxylin and eosin staining in control and infarcted hearts. Magnification ×10. Scale bar, 200 μm. D, representative electrocardiograms before the surgery and 30 min and 3 and 15 days after the IR. The baseline before ischemia shows normal sinus rhythm. Immediately after I/R, an ST elevation in anterior leads V 3–4 was observed. The electrocardiograms 3 and 15 days post-I/R injury indicate a reverse of the ST changes in the anterior and negative T waves in lateral leads. E, left ventricular ejection fraction before and 3 and 15 days after I/R. The LVEF was significantly reduced compared against the respective basal levels. * indicates p value<0.05.

