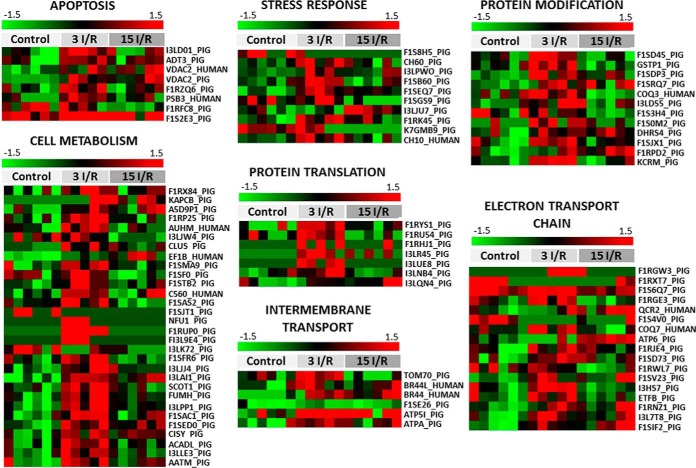
Fig. 3.
Mitochondrial proteins differentially expressed after IR grouped by cellular processes. Green-red heat map values correspond to low-high protein expression levels. The protein normalized value is indicated for each sample. 3 I/R and 15 I/R indicate ischemia/reperfusion with euthanasia after 3 and 15 days, respectively. Fifty seven proteins were differentially expressed 3 days after I/R, 36 of which represented increased expression. However, by 15 days post-I/R, the altered expression observed at 3 days had resolved and normalized back toward the profile of healthy tissue in healthy controls. Thus, 15 days after I/R only, 22 proteins remained differentially expressed, and these included an equal mix of over- or underexpressed proteins. The color track represents the z-score for each protein and is scaled from −1.5 (green) for down-regulated proteins and 1.5 (red) for up-regulated proteins.

