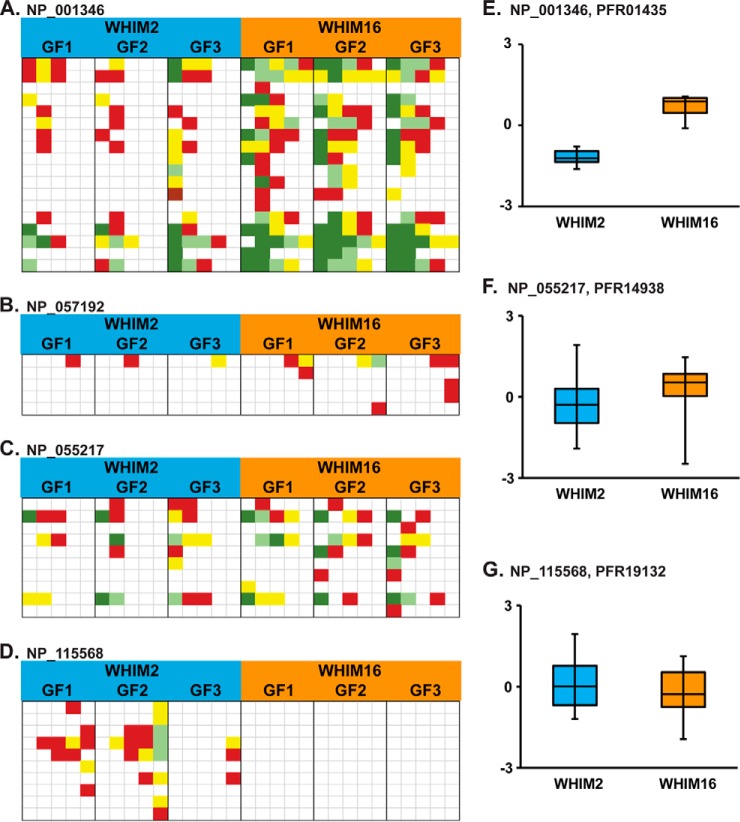
Fig. 5.
Discordant examples of differential expression profiles as measured by BU and TD. Panels A–D show heatmaps generated from BU spectral count data, while panels E–G contain corresponding boxplots from TD MS1 intensity data. Each row of the BU heatmaps represents a separate peptide reporting uniquely on the corresponding protein, while columns in the map represent separate LC-MS/MS runs. Red represents one spectral count in the run, yellow two, light green three, and dark green four or more spectral counts. The box in the boxplots show the median, first, and third quartiles of all MS1 intensities detected for the protein. The bars show the range of the observed data. Panels 5 A and E represent d-dopachrome decarboxylase (NP_001346) BU and TD, respectively; C and F represent cytochrome b-c1 complex subunit 8 (NP_055217), while D and G represent protein phosphatase 1 regulatory subunit 1B (NP_115568). Panel B shows BU data for androgen-induced gene 1 (NP_057192).

