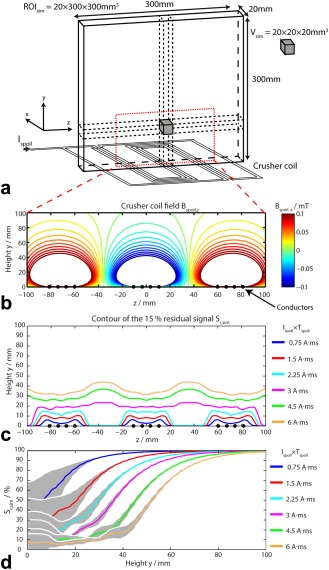
Figure 1.

A: The simulated region of interest (ROIsim) was averaged over 20 × 20 × 20 mm3 simulated voxels of interest Vsim. B: Calculated crusher coil field Bspoil,z with Ispoil = 10 A for the crusher coil geometry shown in (A). C: Contour plot of the 15% residual signal Sr,sim above the crusher coil for different Ispoil×Tspoil. D: Simulated residual signal Sr,sim as a function of the height above the crusher coil for different Ispoil×Tspoil. For each Ispoil×Tspoil, the residual signal was averaged over the region −100 mm < z < 100 mm. The data of plot (D) are represented as intervoxel mean (solid line) ± intervoxel standard deviation (SD) (gray shade). The intervoxel variability is calculated at a specific height y. (B), (C), and (D) plots are zoomed to show only the region bounded by the red dashed line in (A).
