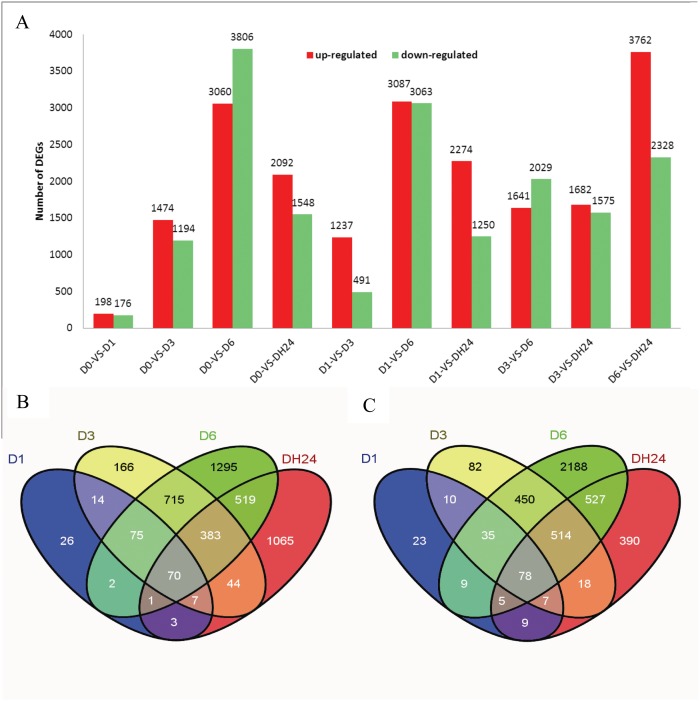
Fig 2. Differentially expressed genes between different libraries.
Up-regulated (red) and down-regulated (green) genes were quantified (A). The ten comparison results are shown. Venn diagram showing the differentially expressed genes at each of the five time points associated with drought stress. (B) Up-regulated genes. (C) Down-regulated genes.

