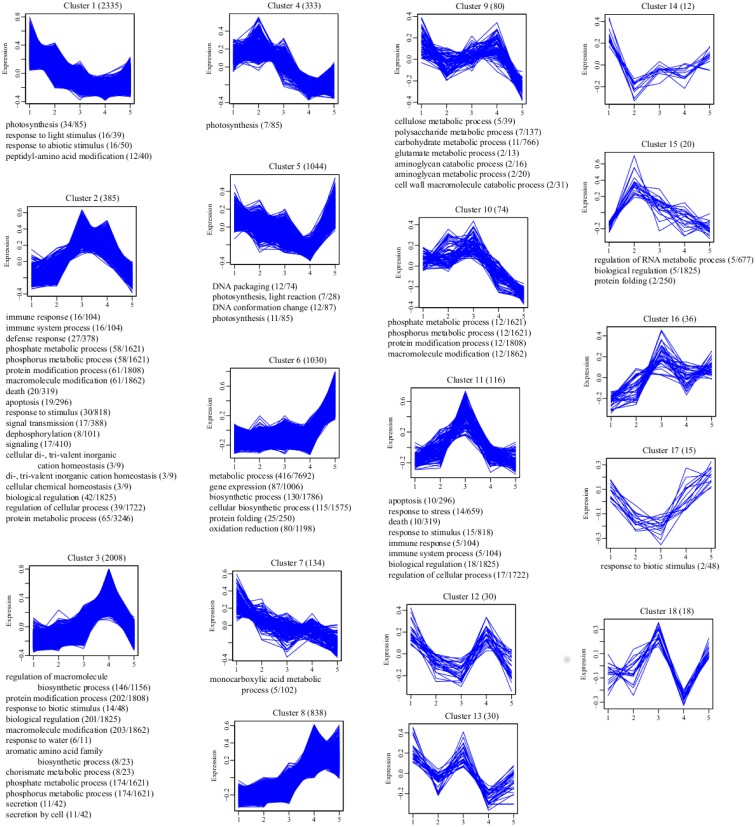
Fig 4. Clustering and gene ontology enrichment of regulated genes.
Genes displaying some degree of regulation were clustered using Hierarchical Clustering. A description of the expression pattern and the number of transcripts belonging to the cluster form the title of each chart. Expression values were normalized and scaled to between –1.0 and 1.0 (Y-axis). Enriched “Biological Process” GO terms, generated in BinGO are listed at the bottom of each cluster. For Clusters 12, 13, 14, 16 and 18, no over-represented “Biological Process” terms were detected. The number of genes associated with an over-represented GO term in the cluster and the number of genes associated with the same GO term in the Pyrus transcriptome are shown in parentheses. Specific genes belonging to each cluster can be found in S3 File. 2 (D1), 3 (D3), 4, (D6), 5 (DH24).

