. 2015 Oct 7;7(2):916–920. doi: 10.1039/c5sc03063c

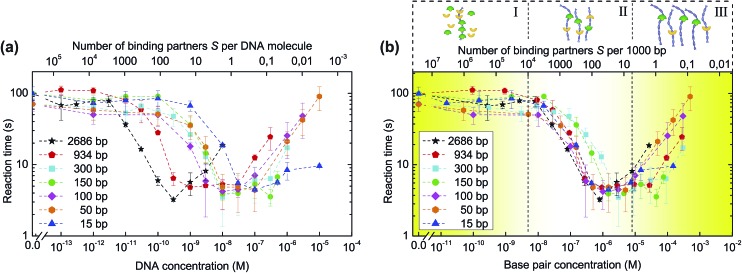
Fig. 3. Influence of DNA length and concentration on the reaction time. (a) Biotin–streptavidin association experiments are repeated for different DNA lengths. Reaction times τ are presented as a function of DNA concentration. (b) Plotting the dependencies of the reaction times on DNA base pair concentration results in curve clustering together in three regions: (I) no speed-up due to an insufficient number of DNA molecules per binding partner; (II) maximum speed-up with the optimal amount of DNA per binding partner; (III) reduced speed-up caused by the amount of DNA being so high that the probability of binding partners to meet on the same DNA molecule diminishes. Error bars indicate ±SD; n ≥ 3.

Fig. 3