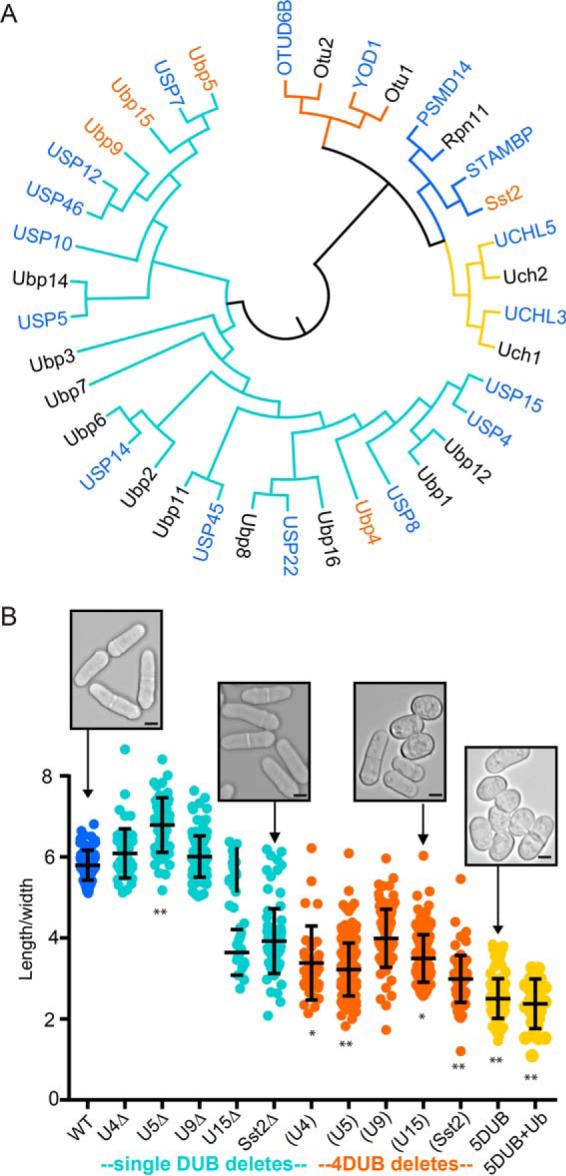
Fig. 1.

S. pombe membrane trafficking DUB degeneracy. (A) Phylogenetic tree of S. pombe DUBs (four enzyme classes, lowercase font) and their human homologs (if present, uppercase blue font). The cohort of five DUBs involved in trafficking are highlighted in orange font. Branches are color-coded to indicate different catalytic domain families (cyan—USP, dark orange—OTU, medium blue—JAMM, light orange—UCH). DUB relationships, but not sequence distances, are indicated. (B) Plot of cell aspect ratios at septation (cell length/cell width ratio) for the indicated strains measured using Image J from DIC images (each point represents one measurement (n > 30); the average and standard deviations are shown as a solid bar and lines). Abbreviations: U4Δ = ubp4Δ1, U5Δ = ubp5Δ, U9Δ = ubp9Δ, U15Δ = ubp15Δ, (U4) = ubp5Δ ubp9Δ ubp15Δ sst2Δ, (U5) = ubp4Δ1 ubp9Δubp15Δ sst2Δ, (U9) = ubp4Δ1 ubp5Δ ubp15Δ sst2Δ, (U15) = ubp4Δ1 ubp5Δ ubp9Δ sst2Δ, (Sst2) = ubp4Δ1 ubp5Δ ubp9Δ ubp15Δ, 5DUB = ubp4Δ1 ubp5Δubp9Δubp15Δ sst2Δ. Asterisks indicated a significant difference between WT and the DUB delete strains (one way ANOVA performed in GraphPad PRISM6). (*) = p < .05 and (**) = p < .0001. Inset images are DIC images from the strains indicated by arrows (scale bars = 4 μm).
