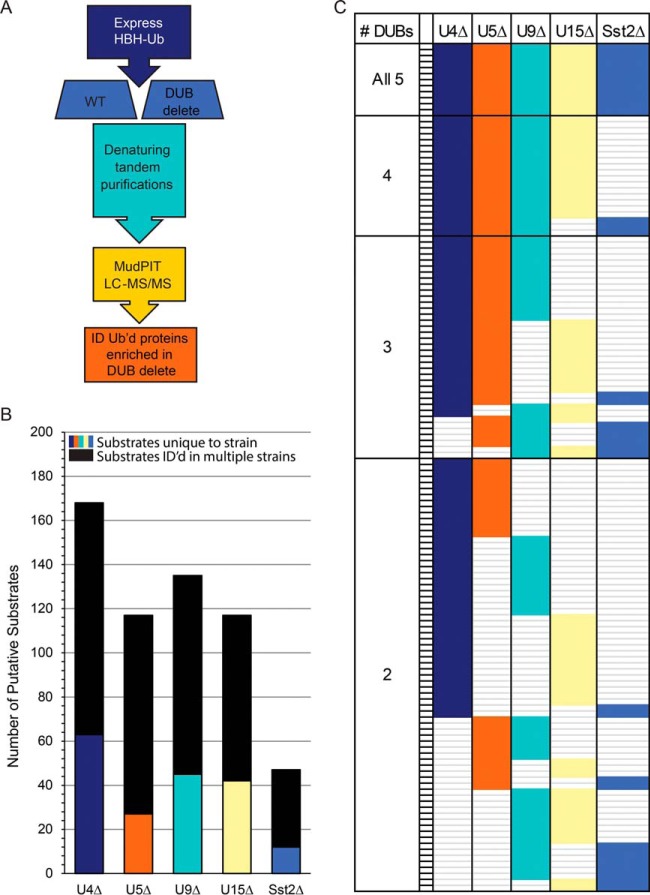
Fig. 2.
Comparative proteomics reveals unique and shared putative substrates among five S. pombe DUBs. (A) Schema of comparative proteomics strategy (see Experimental Procedures for details). (B) Graph of numbers of putative substrates identified for each DUB using the indicated deletion strains (intersection of two independent experiments). Colored bars indicate substrates unique to that strain (DUB), and black bars indicate substrates shared with at least one other DUB. (C) Graph showing the complex relationships between the putative DUB substrates. Each row represents a substrate and the colored bars indicate which DUBs potentially target each substrate. Bar and column titles for the strains are as in Fig. 1.

