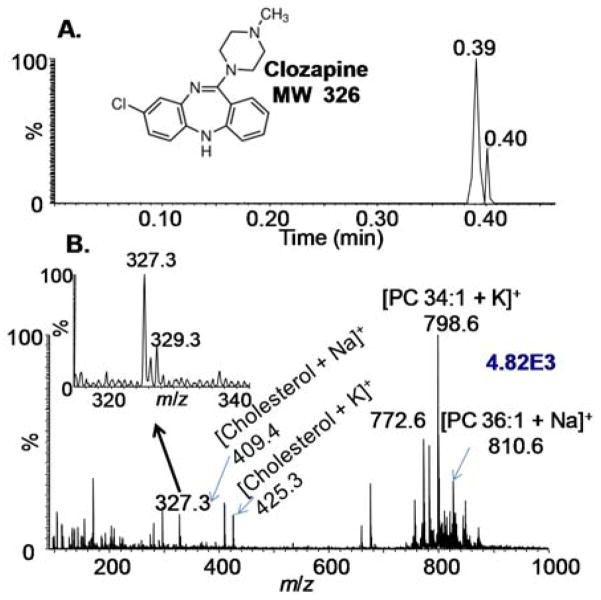
Figure 1.
Fast surface assessment using a SAII method employing surface extraction by 1 μL of MeOH in discontinuous mode as shown in Scheme 1. II.A. (A) TIC of the entire duration of sample analysis including exposure of solvent to surface to ionization in inlet. (B) Mass spectrum extracted from the TIC with the inset showing the isotopic distribution of protonated clozapine ions. The blue number on the top right corner denotes ion abundance.

