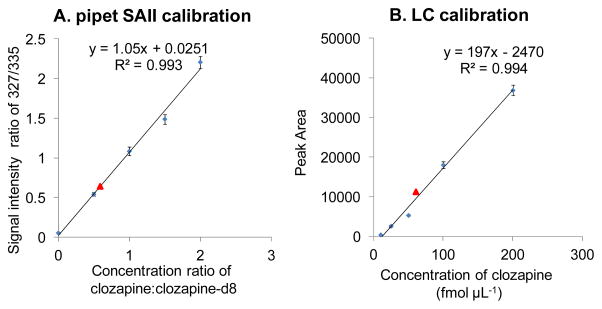
Figure 3.
Calibration curves of clozapine (A) using SAII by pipetting standard clozapine:clozapine-d8 solutions at different concentration ratio with clozapine-d8 at 2 pmol μL−1, signal intensity ratio is plotted against concentration ratio; and (B) using LC-ESI-MS/MS with standard clozapine solutions at different concentration, peak area of the fragment ion at m/z 270 is plotted against concentration.

