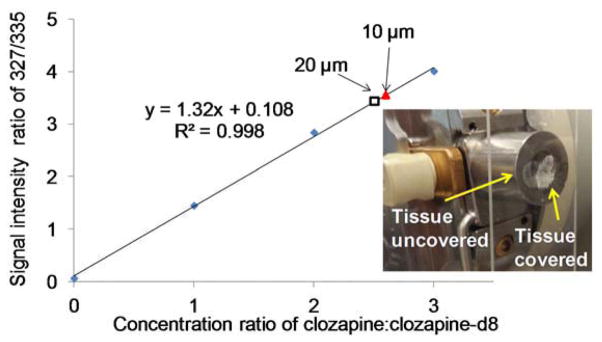
Figure 6.
Calibration curve obtained by spotting 4 μL 3-NBN/clozapine:clozapine-d8 mixture on control mouse brain tissue sections. The glass slide holding the half-covered tissue was then sealed to the vacuum on a modified skimmer cone and let sublime for 10 min (Scheme 2.B). Ion intensity ratio was plotted against concentration ratio. The red triangle and hollow square show the results obtained from 10 μm and 20 μm tissue sections, respectively, from the drug-treated mouse using standard addition method. The inset shows a picture of the modified skimmer cone and a half-covered tissue section.

