Fig. 1.
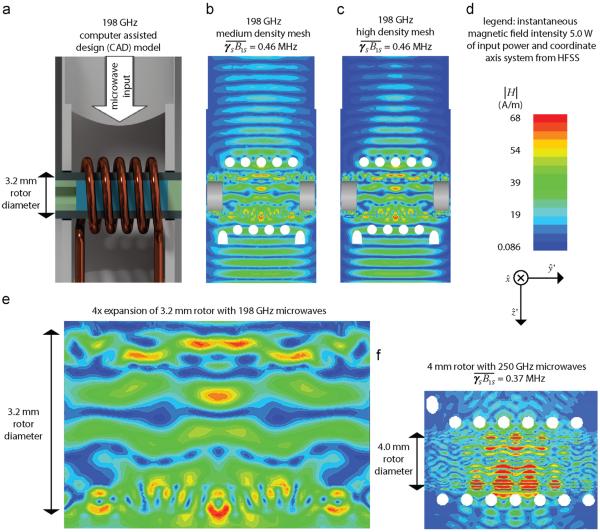
Simulations of the instantaneous magnetic field magnitude in the y′–z′ plane. These intensities are not representative of the γSB1S inhomogeneity as they are dependent on time. (a) A computer assisted design (CAD) representation of our MAS DNP probe. (b) A simulation with a Gaussian beam incident on the sample. The mesh in this simulation has 15,000 tetrahedra within the sample volume. (c) The same simulation as (b) but with a higher mesh of 48,000 tetrahedra in the sample. The microwave distribution is almost identical, suggesting the calculation has converged with respect to tetrahedral density within the mesh. (d) A scale with the magnetic field magnitude normalized to 5 W of input power. (e) An expansion of the simulation of (c) shows considerable fine structure within the sapphire. (f) Simulation of a 250 GHz microwave field structure on the model geometry given in Nanni et al. [39]. The qualitative structures are very similar to Nanni et al. The mesh in the simulation shown above has 94,000 tetrahedra in the sample volume.

