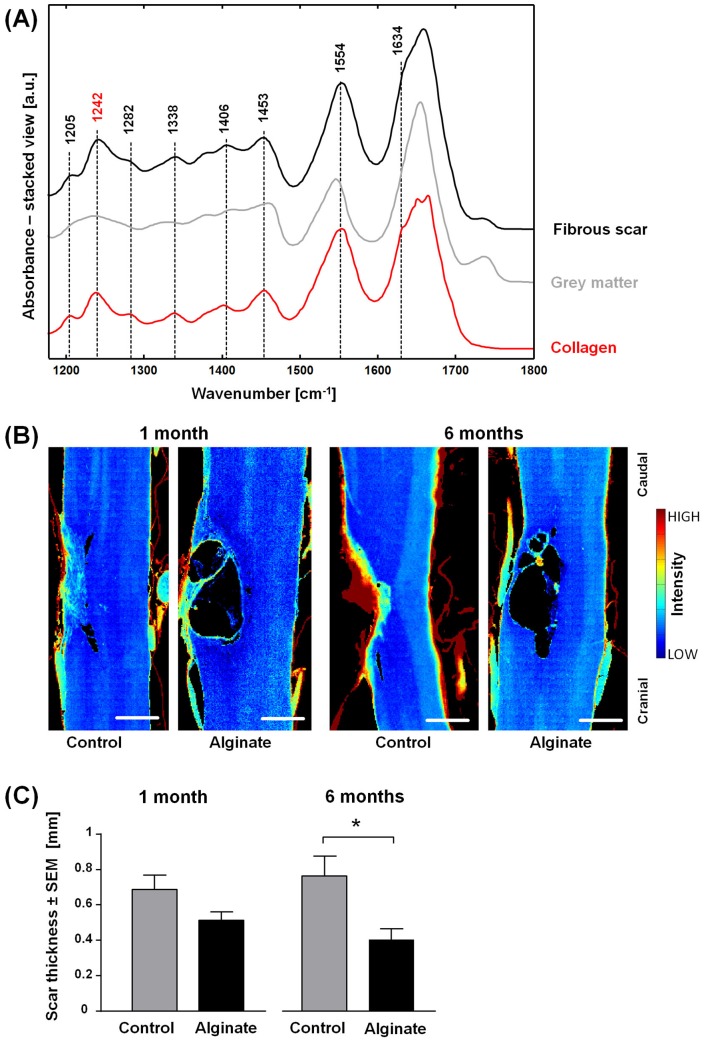
Fig 3. Analysis of the fibrotic lesion.
(A) Representative IR spectra of the fibrous scar six months after injury, of grey matter and of reference collagen. (B) Spectroscopic images showing the intensity of the band 1242 cm-1 in pseudo color. They depict the distribution of collagen in control and alginate-implanted samples one and six months post-injury. Scale bar: 0.5 mm. (C) Fibrous scar thickness of control and alginate-implanted samples at one and six months post-injury, n = 5–7, two-tailed t-test, *: p < 0.05.

