
Fig 4. Regional MRI predictors of MCI-to-dementia progression.
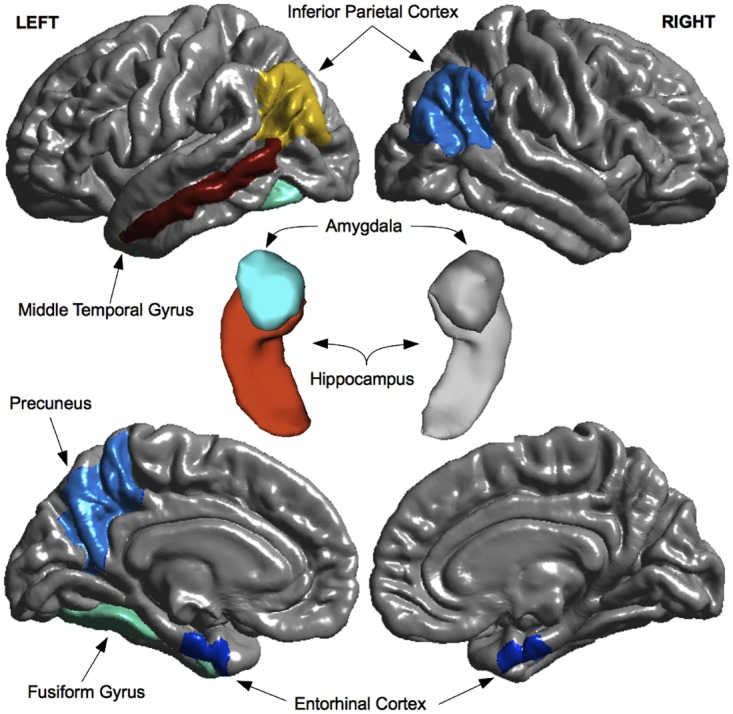
Morphometric measures (volumes and cortical thickness) for brain regions shown in both warm and cool colors were selected as predictors in the single-source MRI model. Morphometric measures for a subset of these regions, shown in warm colors (red, orange, yellow), were also selected as predictors in multi-source (CONCAT and MKL-Gaussian) models. Regions of interest are overlaid on top of 3-D model reconstructions of the brain (gray). Top row: lateral view of the cerebral hemispheres. Center: close-up view of the hippocampus-amygdala complex. Bottom row: medial view of the cerebral hemispheres.