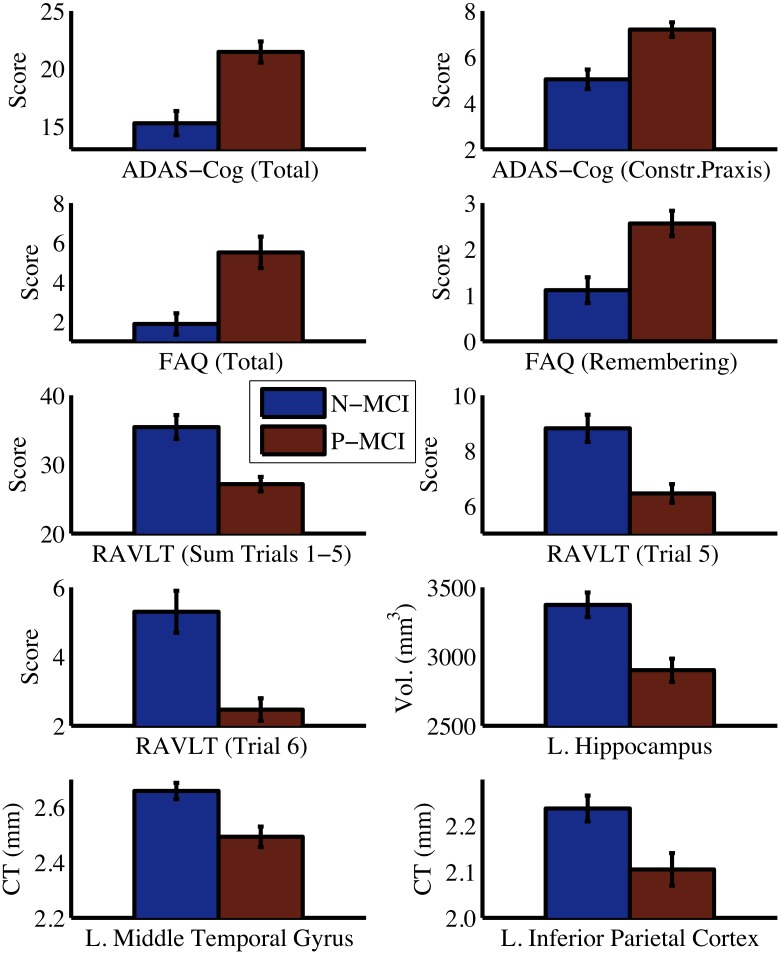
Fig 5. Comparison between N-MCI and P-MCI groups on baseline predictor variables.
Error bars are 95% confidence intervals. Significant group differences were present for all predictor variables (all P < 0.001). Vol. = volume, CT = cortical thickness, ADAS-Cog = Alzheimer's Disease Assessment Scale–Cognitive sub-scale, FAQ = Functional Activities Questionnaire, RAVLT = Rey Auditory Verbal Learning Test, L. = Left, Constr. = Constructional

