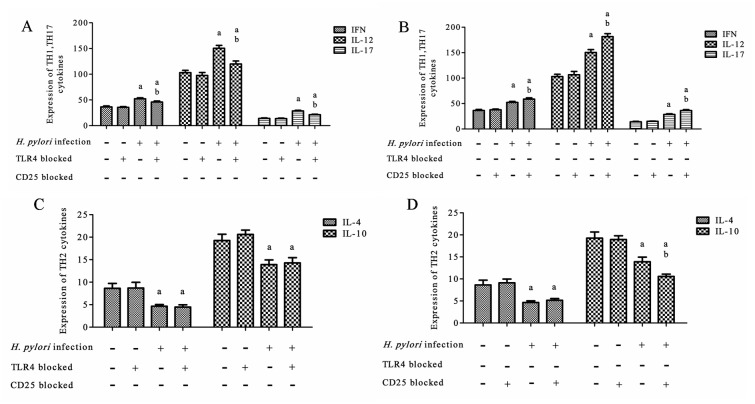
Fig 3. Expression of Th1, Th17, and Th2 cytokines in the gastric mucosa after H. pylori infection.
(A) The expression of Th1 and Th17 with TLR4 blocked; (B) The expression of Th1 and Th17 with CD25 blocked; (C) The expression of Th2 with TLR4 blocked; (D) The expression of Th2 with CD25 blocked. aP < 0.05–0.001 vs. the control or TLR4 blocked control groups; bP < 0.001–0.05 between TLR4 blocked H. pylori and H. pylori groups (Fig 3A); aP < 0.001 vs. the control and CD25 blocked control groups; bP < 0.001–0.05 between CD25 blocked H. pylori and H. pylori groups (Fig 3B). aP < 0.01 vs. control and TLR4 blocked control groups (Fig 3C); aP < 0.01–0.001 vs. control and CD25 blocked control groups; bP < 0.05 between CD25 blocked and non-blocked H. pylori groups (Fig 3D).

