
Figure 2.
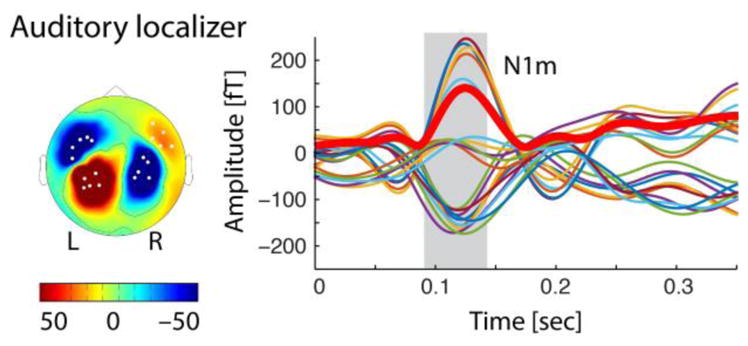
Auditory localizer results from responses to 1000 Hz tones from a representative participant. The topography (left) of the auditory N1m (between 90 and 140 ms post stimulus onset, right) shows a typical source/sink distribution of the magnetic field across left posterior and anterior sites, with a reversal in the right hemisphere. Amplitudes over time (right) are illustrated for the 20 strongest channels (indicated by white dots in the topography). For illustration purposes, the thick red line represents the root-mean squared (RMS) amplitude over the 20 strongest channels.