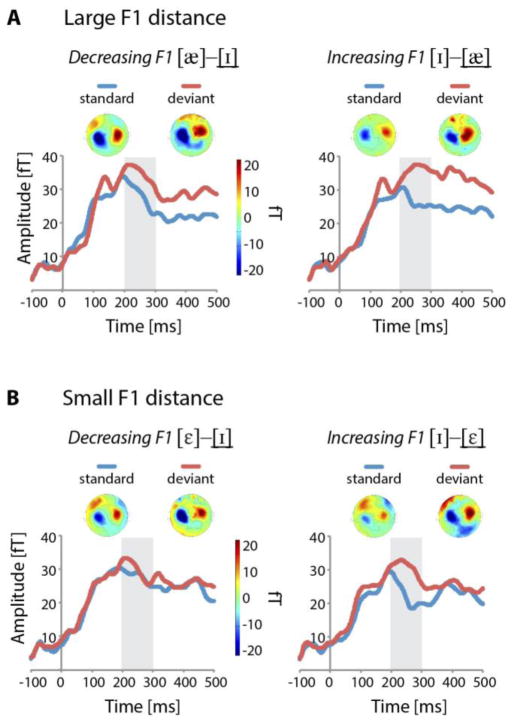
Figure 3.
Grand averaged RMS responses for standards (blue) and deviants (red). A. Standard and deviant responses to the vowels [æ] and [ɪ] in the large F1 distance condition. Note that standard and deviant waveforms stem from different experimental blocks as is common in identity-MMN analyses. Vowels in deviant position are underlined in the header lines. For instance, the left panel shows the deviant response to the vowel [ɪ] and the standard response to the same vowel from the reverse (increasing F1) direction. B. Standard and deviant responses to the vowels [ε] and [ɪ] in the small F1 distance condition. Sensor-level scalp topographies are provided for the time window of 200–300 ms post stimulus onset (marked in grey). RMS-amplitudes are plotted in femto-Tesla (fT, 10−15T).

