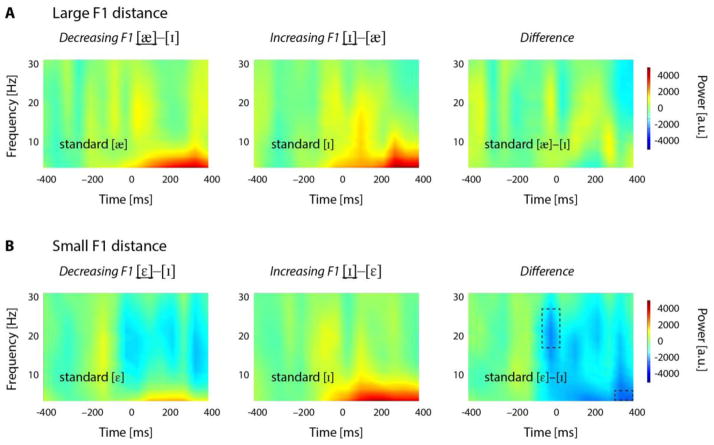
Figure 4.
Time-frequency analyses. Power values are color-coded, with warmer colors for positive power and cooler colors for negative power. A. Total power distribution for the standard vowels [æ] (left) and [ɪ] (middle) in the large F1 distance condition. The difference plot (right) indicates no power differences between the standards. Vowels in standard position are underlined in the header lines. B. Total power distribution for the standard vowels [ε] (left) and [ɪ] (middle) in the small F1 distance condition. The difference plot (right) indicates that there were at least two regions (marked with dashed rectangles) where the power for [ε] was lower than the power for [ɪ]. Power values are in arbitrary units (a.u.).

