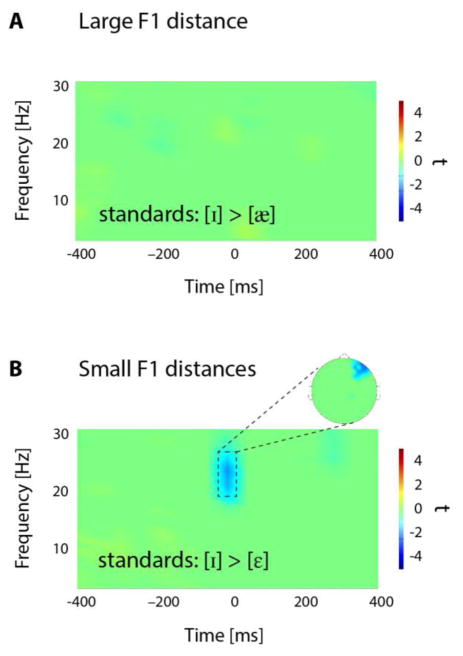
Figure 5.
Results from the multi-level statistical approach on power differences. A. No significant time-frequency bins are observed for the standard vowel contrasts in the large F1 distance condition. No time-frequency bin survived the cluster-permutation based statistical threshold (critical t-value = ±2.18). B. Significant time-frequency bins for the standard vowel contrasts in the small F1 distance condition were found between −50 and +20 ms and between 18 and 26 Hz, indicated by the dashed rectangle. The blue colors shows t-values that survived the statistical threshold. In these time-frequency bins, power was significantly lower for [ε] than for [ɪ].

