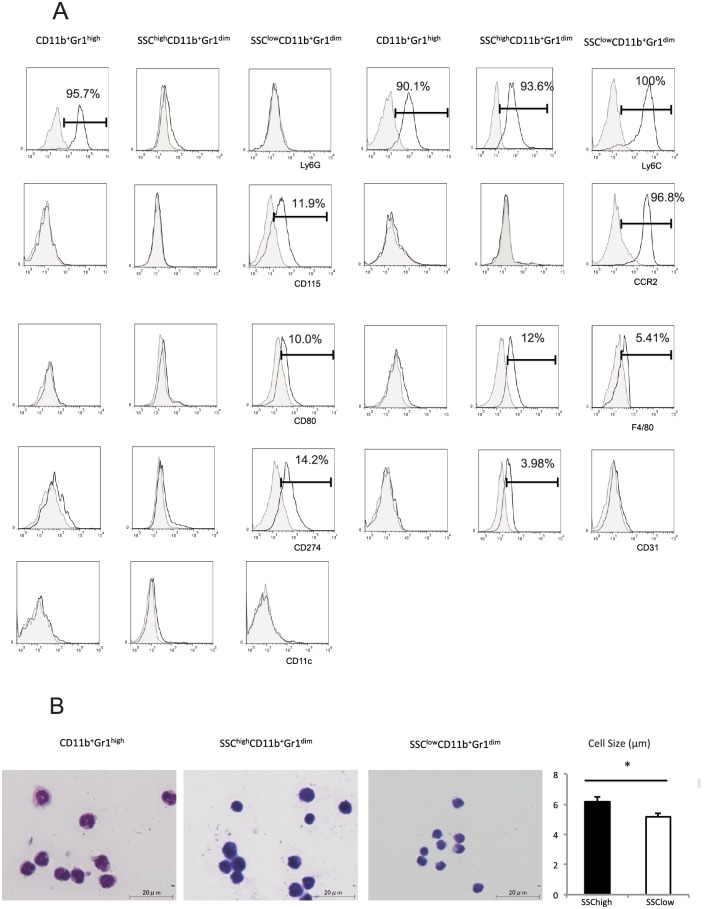
Fig 2. Characterization of liver CD11b+Gr1+ cell subsets.
(A) Representative histograms of the phenotypic profiles of liver CD11b+Gr1high, SSChighCD11b+Gr1dim, and SSClowCD11b+Gr1dim cells. Closed histograms represent background control staining; open histograms represent staining by indicated monoclonal antibody (mAb). The percentage of positive cells is indicated. (B) Morphology of purified liver CD11b+Gr1high, SSChighCD11b+Gr1dim, and SSClowCD11b+Gr1dim cells by Wright-Giemsa staining (100× magnification). Scale bars, 20 μm. SSC, light side scatter. The sizes of SSChighCD11b+Gr1dim and SSClowCD11b+Gr1dim cells are shown in the right panel. *P < 0.05

