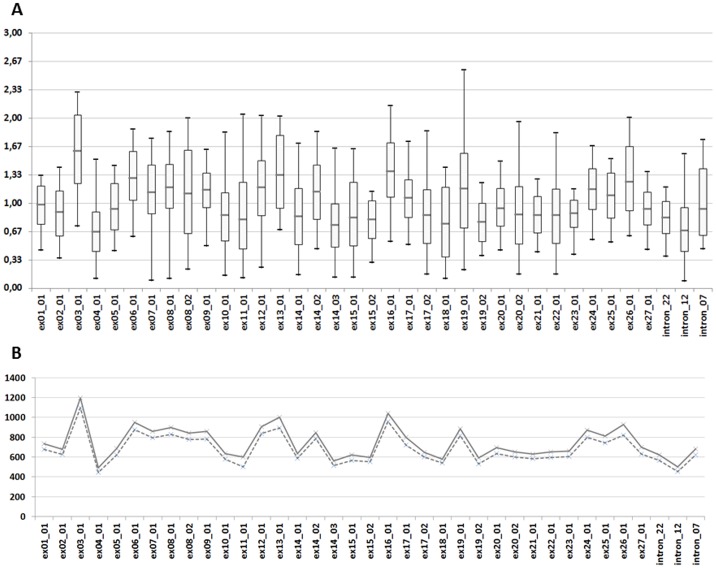
Fig 2. Depth of coverage analysis for phase 2 samples.
The coverage analysis is based on the number of R1 reads counted for each amplicon with MiSeq Reporter. Values were calculated for the 275 samples tested in phase 2 (CNVs positive controls were excluded). (A) Box plot diagram of the RPCCOV. Box plots show mean (horizontal grey line), 95th percentile values (box outline) and minimal/maximal values (whiskers). (B) Mean (solid line) and median (dotted line) depth of coverage values by amplicon.

