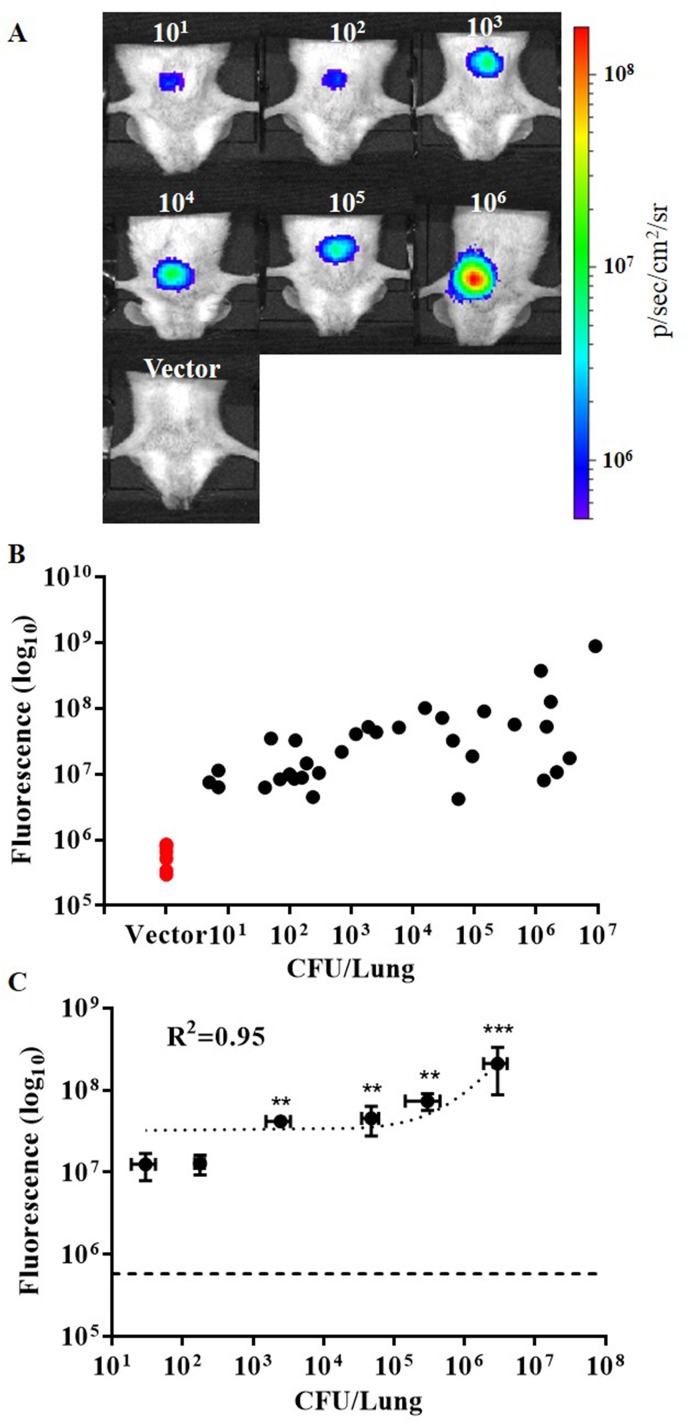
Fig 4. Intravital fluorescence excitation of tdTomato expressing BCG after intratracheal pulmonary infection of mice.
(A) Representative whole-body images acquired using integrated microendoscope (intravital fiber excitation) at 24 hr post-infection with 101−106 colony forming units (CFU) BCG17 (tdTomato expressing BCG strain) and 105 CFU BCG39 (BCG containing the same vector that does not express tdTomato (Vector)). (B) Scatter plot of fluorescence signal for each animal imaged as compared to actual CFU in lung homogenates from the same mouse. (C) Correlation of fluorescent signal to number of bacterial CFU in lung homogenates. Error bars represent the standard error for each sample group. **p‐value < 0.01, ***p‐value < 0.001: significantly different from fluorescence of vector control group (horizontal dashed line in C) calculated by non-parametric Kruskal-Wallis test with the Bonferroni posttest. All images and measurements represent tdTomato contribution to signal after spectral unmixing.

