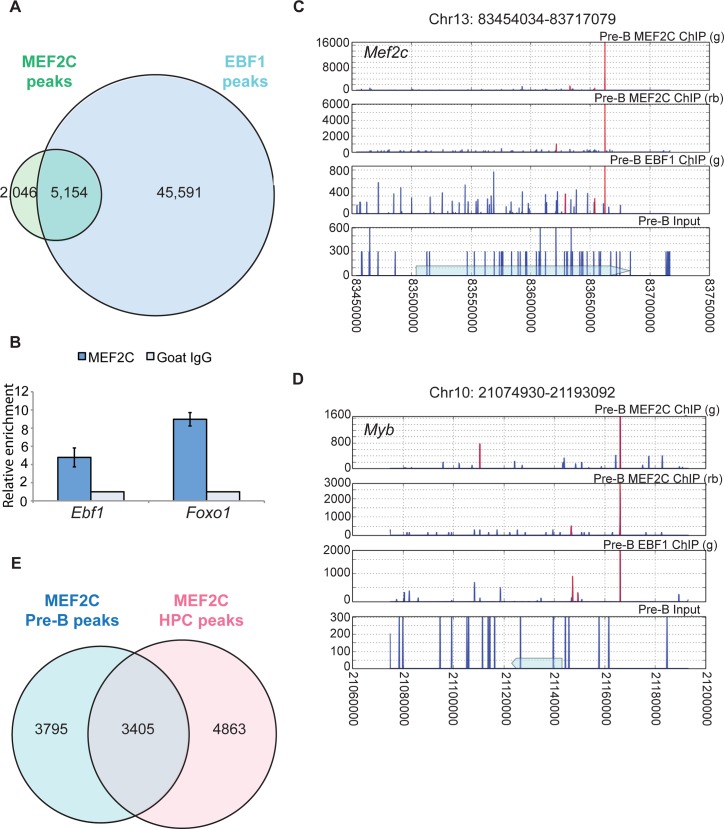
Fig 2. MEF2C and EBF1 co-occupy many B lineage genes.
(A) Venn diagram of MEF2C and EBF1 overlapping ChIP-seq peaks in pre-B cells. MEF2C peaks are those commonly shared in two separate ChIP experiments, as shown in S2A Fig. (B) ChIP-qPCR validation of MEF2C binding near Ebf1 and Foxo1 genes. (C, D) Representative MEF2C and EBF1 ChIP-seq profiles at Mef2c and Myb loci, with the corresponding antibody used in the ChIP indicated (g for goat, and rb for rabbit); blue arrow on the input track indicates the position of the gene; red lines denote the highest called peak using MACS1.4. (E) Venn diagram of overlapping MEF2C ChIP-seq peaks in hematopoietic progenitor cells (HPCs) and in pre-B cells; two separate ChIP experiments were included for each cell type.

