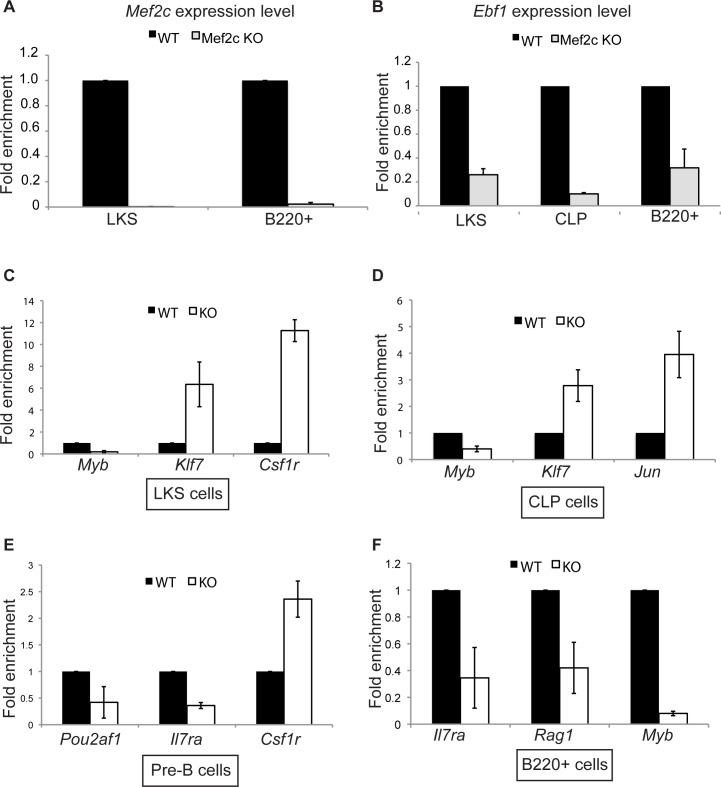
Fig 4. Relative expression levels of various hematopoietic genes in different lineages.
(A) Relative expression levels of Mef2c in LKS and B220+ (all B lineage) cells sorted from Mef2c-KO mice (gray bars) or WT littermates (black bars). (B) Relative expression levels of Ebf1 in LKS, CLPs, and B220+ cells sorted from same mice as in (A). (C)-(F) Relative expression levels of various B cell genes (Myb, Pou2af1, Il7r, and Rag1) and myeloid genes (Klf7, Csf1r, and Jun) in LKS, CLPs, Pre-B, or B220+ cells sorted from Mef2c-KO mice (white bars) or WT littermates (black bars) as determined by qRT-PCR. Experiments were performed in either technical triplicates or biological triplicates.

