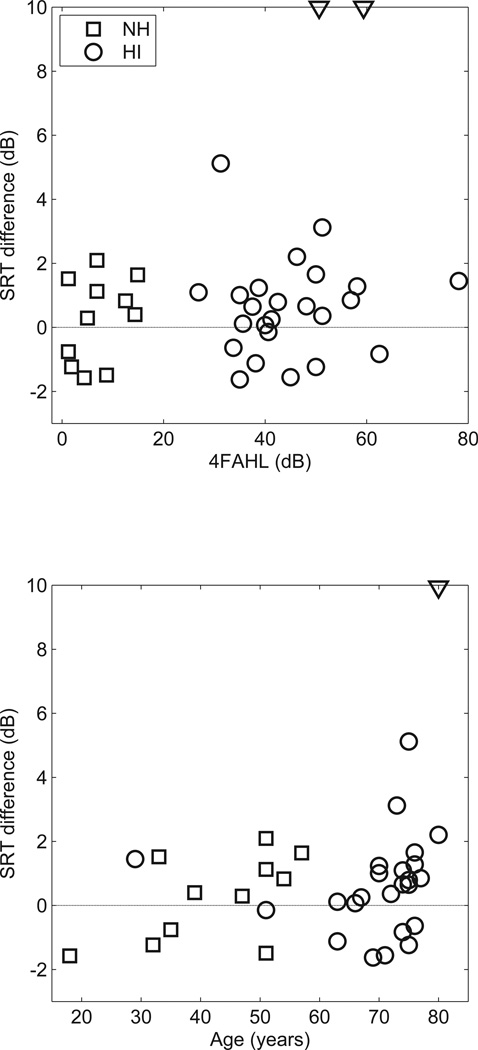
Figure 3.
Scatterplot showing the difference in unaided SRTs between the two tests (comprehension SRT – sentence SRT) as a function of 4FAHL (upper panel) and age (lower panel). Different symbols indicate NH listeners (squares) and unaided HI listeners (circles). The two HI listeners who could not perform the comprehension test are shown by triangles.

