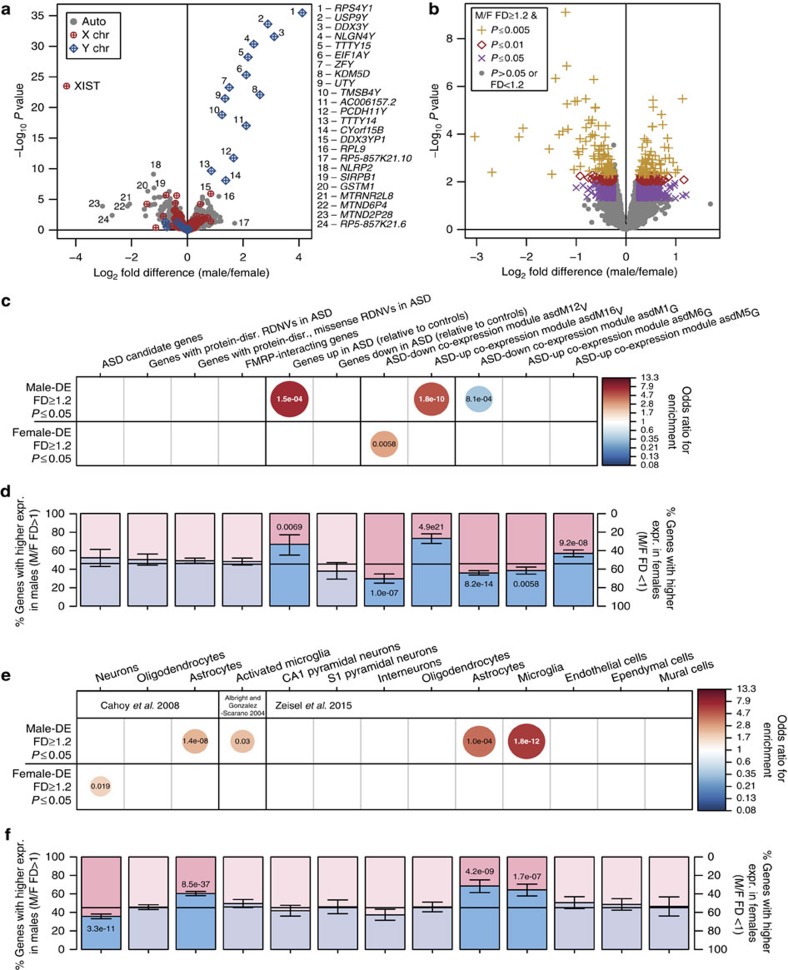
Figure 1. Microglia and astrocyte markers and genes upregulated in ASD brain tend toward higher expression in adult male brain.
(a) Volcano plot for the differential expression results from all 16,392 transcripts expressed in the adult BrainSpan sample (n male=29 samples from 5 subjects, n female=29 samples from 5 subjects). (b) Subset of the volcano plot in a for all 15,724 autosomal transcripts. (c) Enrichment for ASD risk genes and ASD-associated gene expression patterns, and (e) neural cell type markers, within male-DE (higher expression in males, FD⩾1.2, P⩽0.05; 439 genes) and female-DE (higher expression in females, FD⩾1.2, P⩽0.05; 427 genes) gene sets by Fisher's exact test; circle size and colour indicate the odds ratio of all significant overlaps (Bonferroni-adjusted P value <0.05); overlaid text displays the adjusted P value for each enrichment. (d) Shifts in the distribution of sex-differential expression direction for genes in each ASD risk or ASD expression sets, and (f) neural cell type markers. Blue and pink bars display the proportions of each gene set that have higher expression in males (FD>1) or females (FD<1); whiskers note 95% confidence intervals; horizontal black lines note the proportion of male- and female-higher genes in the corresponding background gene set. Overlaid text displays significant Bonferroni-adjusted P values from the binomial test. chr, chromosome; disr., disrupting; expr., expression; F, female; M, male.

