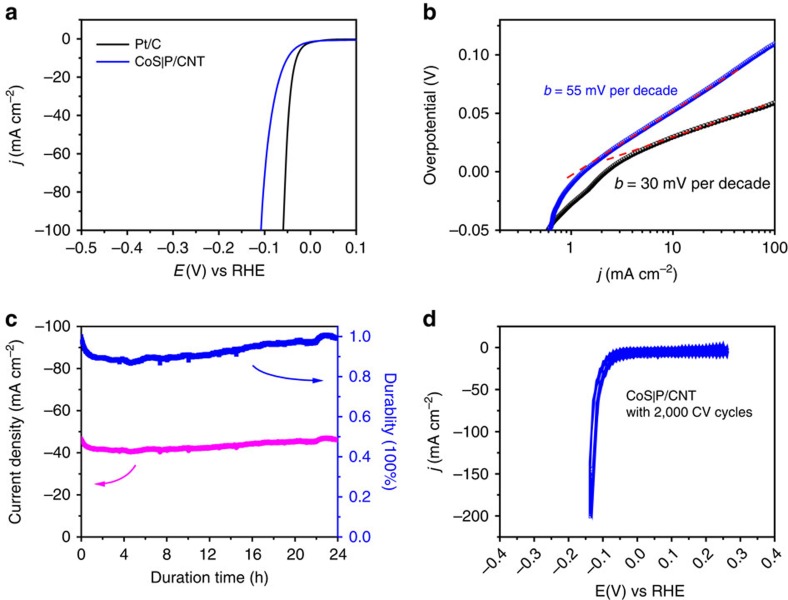
Figure 4. Electrocatalytic hydrogen evolution over the CoS|P/CNT catalyst.
(a) Polarization curves for HER on the CoS|P/CNT hybrid and a commercial Pt/C catalyst at 5 mV s−1. The catalyst mass loading was 0.4 mg cm−2 for Pt/C catalyst. (b) Tafel plots for the CoS|P/CNT and Pt/C catalysts derived from the polarization curves in a. (c) Chronoamperometric response (j∼t curve) recorded on the CoS|P/CNT electrode at a constant overpotential of 95 mV with iR compensation. (d) CV test between 0.25 and −0.12 V versus RHE at a scan rate of 100 mV s−1 for 2,000 cycles. The catalyst mass loading of CoS|P/CNT was 1.6 mg cm−2 unless otherwise noted.

